
 |
Upper Mississippi River Restoration ProgramLong Term Resource Monitoring |
|
| |
||
Land Cover/Use
Data |
||
2010 Land Cover/Land Use
|
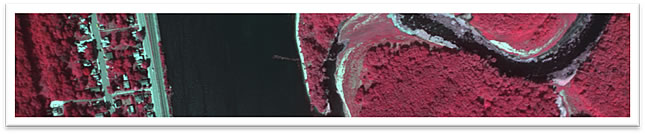
Technology doesn’t stand still and neither does the vegetation mapping program. With 9X9 film and film cameras becoming increasingly rare, the 2010 systemic aerial photo effort will use a digital mapping camera to collect 8”/pixel imagery above Lock & Dam (L&D) 13 and 16”/pixel imagery below L&D 13 and along the Illinois River floodplain. There are two main reasons for this distinction; 1) the floodplain above L&D 13 is narrower and contains a greater amount and diversity of aquatic vegetation, and 2) below L&D 13, the Upper Mississippi River is largely channelized, with less aquatic vegetation, and wider, leveed floodplains dominated by agricultural use. This holds true for much of the Illinois River as well and the lower resolution imagery allows for more efficient acquisition, processing, and map creation. |
On-board GPS and an inertial measurement unit (IMU) deliver precise location and time-of-collection information that will allow UMESC to create mosaics accurate to within several meters of their real-world settings. These mosaics are used by Center botanists to groundtruth vegetation in the field, collecting notes for use when performing photointerpretation back in the office.
Along with the evolution of image acquisition comes a corresponding improvement in data set creation. Since 9X9 film is no longer used, stereoscopes are a thing of the past and data set production is completely digital. Imagery is still collected at 60% overlap but stereo viewing is now accomplished with active shutter glasses and 120 Hertz 3D stereo monitors. The right and left lens and aerial photo flash at 60 times a second, too fast for the eye to notice, and provide an extremely high-resolution stereo image. This technology was developed for games and movies but works very well for GIS applications, too.
Stereo models are developed for each flight line and used to display image pairs in 3D. Mapping software and computer mice are then used to create instantly georeferenced data. The same hydrology-based plant classification system and the same photointerpreters used to map the UMRS in 2000 will be used for the 2010 Land Cover/Land Use (LCU) project, providing the ability to directly compare the two data sets. Minimum mapping units will be 1.0 hectare for the 16”/pixel imagery and 0.5 hectares for the 8”/pixel photos.
Once selected pools are completely interpreted, automated and quality-checked, either a thematic accuracy assessment (Pools 13 and the La Grange Pool of the Illinois River) or a validation (Pools 13, 26, and Open River South) will be performed. Note that Pool 13 is targeted for both a thematic accuracy assessment and a validation. Completing both methods on one LCU spatial data set will give a direct comparison between the two methods. If methods prove to be similar in results, the more cost effective option of validation can be used in land cover mapping conducted in future assessments.
An accuracy assessment (AA) is the process whereby experienced or trained botanists compare sample points of interpreted vegetation polygons to their real-world counterparts in the field. This method is time-tested and, when performed correctly, the best test of a data set’s accuracy. Due the travel involved and the number of points assessed, it can also be quite costly and time-consuming. The objective of an AA study is to measure the probability that a particular location has been assigned its correct vegetation class. An AA estimates thematic (map class) errors in the data, giving users information needed to determine data suitability for a particular application.
In comparison, a validation is performed by experienced botanists in the office using sample points derived from the completed vegetation data set and then viewing those points on the original stereo aerial photography. The botanists will use 3D stereo monitors to determine the vegetation type at the sample point’s location and compare their classification to the original classification. Since no field work is required, a validation can be accomplished much more efficiently and at far less expense than an on-site assessment.
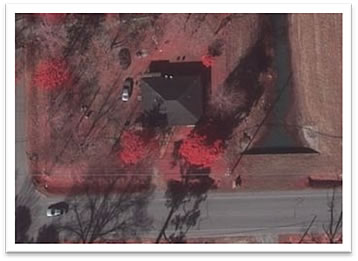 8"/pixel sample |
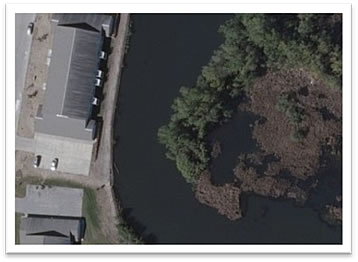 16”/pixel sample |
Component specialists: Jennifer Dieck and Andrew Strassman

Page Last Modified: October 17, 2024