
 |
Upper Mississippi River Restoration ProgramLong Term Resource Monitoring |
|
| |
||
Land Cover/Use
Data |
||
2000 Land Cover/Land Use
The 1989 systemic LCU data set provided an excellent learning experience, both in terms of how long such an ambitious undertaking would take, and the difficulties involved in applying a plant-based classification system to a dynamic and complex ecosystem. The 1:15,840-scale allowed for delineating vegetation units as small as a tenth of an acre but it soon became apparent that a minimum mapping unit was necessary to complete this data set by the end of the decade. While resource managers and scientists liked the unprecedented detail of the 1989 LCU, most analyses were performed on a generalized class that the species classes collapsed into. There was also concern over the length of time it took to complete the 1989 LCU and if the data were still relevant ten years later. This feedback from the data users led to a revised collection and interpretation protocol for the 2000 LCU. |
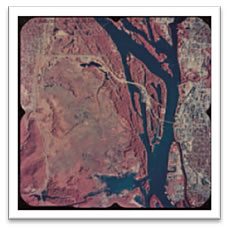 To facilitate a faster turnaround, the imagery scale was increased to 1:24,000 (or nearly 12 square miles per photo), the vegetation classification system was generalized using hydrology-based classes, and a one-hectare (approximately 2.5 acres) minimum mapping unit was implemented. As a result, the entire system was mapped and available online only four years after the aerial photography was acquired.
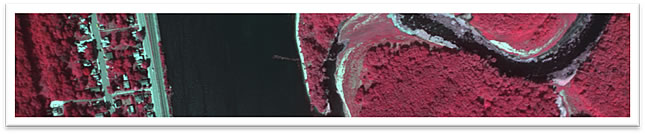
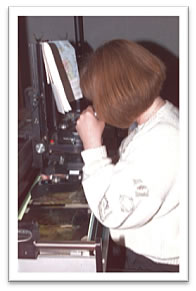
As with the 1989 LCU, color infrared film was sliced into individual frames and thin, clear pieces of mylar were taped to each frame. Neat lines were drawn on each mylar overlay to delineate the area being interpreted and then fine-tipped technical ink pens were used to draw vegetation types called polygons.
Unlike in 1989 however, faster computers and more specialized GIS software were used to scan and reference these delineated overlays to the earth’s surface. Digital elevation models, ground control points, and digital orthophoto mosaics were used to ‘warp’ the polygons to the earth, creating data sets accurate to real world locations at 10 meters or better. Hand-digitizing was no longer necessary by 2000 and software converted the scanned raster-based overlays into vectors. After labeling and quality control checks, the data were uploaded and served via UMESC’s web site.
More detailed information on this process is available in the PDF located at: https://pubs.er.usgs.gov/publication/tm2A1
Component specialists: Jennifer Dieck and Andrew Strassman

Page Last Modified: October 17, 2024