Vegetation Update Title Page
Methods
Sampling procedures are described in detail in Yin
et al. (2000). The following is a brief description of the overall
design.
Purpose
The objective of the sampling
program was to accumulate data on the distribution, frequency of occurrence,
and relative abundance of aquatic vegetation within pools over a
long period (>50 years) using a standardized protocol across the
system.
Stratification
A stratified random approach was initiated in 1998. Sampling sites
were distributed in shallow water areas where water depth was less
than or equal to 3 m at flat-pool condition. After 1998, sampling
sites were distributed in less than or equal to 2.5 m depth. Deeper
water areas generally do not support aquatic vegetation. Shallow
water areas were divided into several habitat types (strata), including
main channel borders, secondary channels, contiguous backwaters,
isolated backwaters, and impounded areas (Figure
1). Sampling efforts were proportional to acreage and perceived
habitat heterogeneity of each stratum, except for the isolated backwater
areas where sample sites are limited because they are time consuming
to conduct. Some areas were excluded from the sampling because of
safety concerns and difficulties with access.
Site Selection
A 50- X 50-m grid was generated and overlaid onto the stratified
aquatic areas. Nodes of the grid were geospatially registered (Universal
Transverse Mercator coordinates), and nodes that fell in the sampling
strata were eligible for selection. Sites are reselected annually using a
random number generator except for Pool 8 where the sample sites were held constant between 2002 and 2004. We navigated to the general area of a site
using an enlarged hard-copy map and then switched to global positioning
system (GPS) equipment with differentially corrected signals as
the boat approached the targeted location. The boat was anchored
at bow and stern when both the easting and northing coordinates
displayed on the GPS unit were within 10 m (- or +) of their selected
node. The actual GPS coordinates were read and recorded twice at
each site, once immediately after the boat had been anchored and
again before the boat was released for departure.
Equipment and Definitions
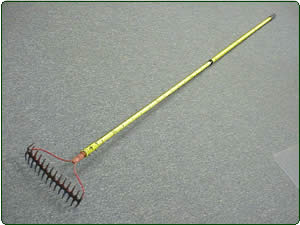 Submersed
aquatic vegetation was collected using a long-handled, double-headed
rake modified from Jessen and Lound (1962) and Deppe and Lathrop
(1992). The rake is 36 cm (14 inches) wide, has 14, 5-cm (2 inches)
long teeth on each side, and was made by welding two square-headed
garden rakes together. The teeth are divided and marked into five
equal parts (or 20% increments). The handle is about 3 m long, with
a rope extension, and is scaled at 10-cm increments. Aquatic vegetation
or aquatic species refer to the following plant types or life forms:
submersed (S), rooted floating–leaf (F), and emergent (E). Submersed
aquatic vegetation was collected using a long-handled, double-headed
rake modified from Jessen and Lound (1962) and Deppe and Lathrop
(1992). The rake is 36 cm (14 inches) wide, has 14, 5-cm (2 inches)
long teeth on each side, and was made by welding two square-headed
garden rakes together. The teeth are divided and marked into five
equal parts (or 20% increments). The handle is about 3 m long, with
a rope extension, and is scaled at 10-cm increments. Aquatic vegetation
or aquatic species refer to the following plant types or life forms:
submersed (S), rooted floating–leaf (F), and emergent (E).
Site and Subsampling Areas
Each site had six subsampling areas, each of which
was a rectangular area approximately 1.5 m long and 0.36 m wide
(the width of the rake head). One subsampling area was located
off each corner of the boat and the other two were located, one
each, off the left and right sides. Number of sample sites can
be found in Table 1.
Sampling and Data Recording
Individual species and different life forms of aquatic
vegetation (e.g., submersed and rooted floating–leaf) were
recorded as either present or absent at each subsampling area based
on visual examination and a rake sample. When present, submersed
species were given a density rating (see data at lower left) based
on their thickness on the rake teeth. When present, rooted floating–leaf
and emergent species were given a percent cover rating based on
visual examination (see data at lower right). Species that had not
been recorded in the six subsampling areas but were observed at
the site were recorded and marked as "additional species." Fassett
(1957), Voss (1972, 1985), and Gleason and Cronquist (1991) were
the primary references used for plant identification. Scientific
nomenclature and common names are based on those found in the U.S.
Department of Agriculture's PLANTS Database (USDA, NRCS 2004; http://plants.usda.gov/).
|
Submersed vegetation
density ratings
|
|
Emergent and rooted floating-leaf vegetation
cover ratings
|
|
|
|
|
Percent of rake teeth filled
|
Density rating
|
|
Percent of area covered
|
Cover rating
|
|
|
|
|
81-100
|
5
|
|
81-100
|
5
|
|
61-80
|
4
|
|
61-80
|
4
|
|
41-60
|
3
|
|
41-60
|
3
|
|
21-40
|
2
|
|
21-40
|
2
|
|
1-20
|
1
|
|
1-20
|
1
|
|
no plants retrieved
|
0
|
|
none
|
0
|
|
|
|
Computation of Summary Indexes
Summary indices were computed for individual strata as
well as entire pools. In addition, Pool 4 was split into upper
and lower sections divided by Lake Pepin because the two sections
displayed distinctly different vegetation dynamics. In Pool
26, data from the lower 12 miles of the Illinois River were computed
separately from the Mississippi River portion because the data represent
two different rivers.
|
Frequency |
|
Percent frequency of occurence values in this report was computed by dividing
the number of sites where a species was recorded by the number
of sites investigated in the stratum and then multiplied
by 100 to convert it into a percentage.
The frequency value in a pool was computed by averaging the
frequency values of the shallow water strata, weighted by
acreage:
where Fj is the frequency
in stratum j and Sj is the acreage of stratum
j. |
|
Abundance
Index |
|
An index was created to measure the quantity of a submersed
species using both presence or absence and plant density rating
data recorded in the six subsampling areas. We called it the
abundance index to differentiate it from the frequency index.
The abundance index was computed according to the following
formula:
where Vi is the presence or absence (1,0)
and Ri is the plant density ranking (0,1,2,3,4,5) data
for the ith subsampling areas at the site (i = 1,2,3,4,5,6).
Data are treated before computation so that Vi = 1
if Ri >= 1 and, vice versa, Ri >= 1 if
Vi = 1.
The abundance index for a stratum was computed as the simple
average of all its sites.
The abundance index for a pool was
computed as the average of all shallow water strata, weighted
by acreage:

where Aj is the abundance
index of the species in stratum j and Sj is
the acreage of stratum j. |
|
Percent
Cover (rooted floating–leaf and emergent life form) |
|
The percent cover of rooted floating–leaf and emergent
life forms in a stratum was computed using the following formula:

where Lj is the cover rating at individual sites and
A is the midpoint of the corresponding percent cover,
and M is the total number of sites in the stratum.
Percent cover in a pool was computed as the average of all
shallow water strata, weighted by acreage:

where Cj is percent cover
in stratum j and Sj is the acreage of stratum
j.
|
Chronological Summary of Method Changes
| Prior to the beginning of stratified random sampling in 1998, vegetation transect data have been collected every year starting in 1991 to 2000 and were collected in the months of May through August (except for La Grange Pool that has some September data as well). There was a 3-year overlap of sampling methods during this transition so temporal patterns between the two methods could be evaluated. Data can be downloaded from the Vegetation Transect Database Browser with reports found at Vegetation Annual Status Reports. |
| |
| Year 1998: Sampling sites were distributed among locations
within strata less than or equal to 3-m water |
| |
depth. |
| |
|
Year 1999:
In 1999, sample sites were restricted to areas less than
or equal to 2.5 m water depth. |
| |
In 1998, the target number of sites
was 550 for all pools. The target number of sites changed to 600 in
Pool 8 and 650 in Pool 26 in 1999. Changes in the target
number of sites were based on the variance from the previous
year.
|
| |
|
|
Year 2000:
The target number of sites was changed to 635 in
Pool 4, 650 in Pool 8, 580 in Pool
13, 400 in Pool |
| |
26, and 430 in La Grange Pool based on the
variance from the previous year. |
| |
|
|
Year 2001:
The target number of sites was changed to 650 in
Pool 4, 670 in Pool 8, 610 in Pool
13, and 420 in |
| |
Pool 26 based on the variance from the previous
year. In Pool 11, 568 sites were sampled to provide data on other pools in the system. |
| |
|
|
Year 2002:
The target number of sites was changed to 635 in
Pool 4, 650 in Pool 8, and 580 in Pool 13 based |
| |
on
the variance from the previous year. Sites were sampled in
Pools 5 (404), 7 (406), and 12 (405) and Alton Pool (513) to
help determine how representative the standard pools (4, 8,
13, and 26 and La Grange Pool) were of the Upper Mississippi River
System.
A drawdown was conducted in Pool
8 in 2001 and 2002. In 2002, we revisited the 2001 sites
in Pool 8 (except for 20 isolated backwater sites) to allow
for the calculation of change estimates for not only the pool
and strata but also for individual sites, thereby increasing
the statistical power to identify drawdown related vegetation
responses. |
| |
|
Year
2003: In 2003, 650 sites were
sampled in Pool 8 and 580 sites in Pool 13 based on the variance from the |
| |
previous year. Because of budget reductions, no LTRMP-funded aquatic vegetation
sampling was conducted in Pools 4 and 26 and La Grange Pool.
However, aquatic vegetation was sampled from the three pools
by other agencies using LTRMP protocols, and the data were
graciously provided to the LTRMP.
Pool 26 was sampled by the Illinois Natural History Survey
under a grant provided by the National Great Rivers Research
and Education Center. La Grange Pool was sampled by
the Illinois Natural History Survey under a grant provided
by the Illinois Department of Natural Resources. Aquatic
vegetation data from Pool 4 were provided by the U.S. Fish
and Wildlife Service and the Division of Fisheries, Minnesota
Department of Natural Resources. Two strata, isolated backwater,
and Lake Pepin were not sampled.
In 2003, we again revisited the
sites selected in Pool 8 (except for the 20 isolated backwater
sites) in 2001 to continue to monitor vegetation response
to the drawdown. |
| |
|
Year 2004: Sampling was conducted
in LTRMP key Pools 4, 8, 13, and 26 of the Mississippi River and La Grange |
| |
Pool of the Illinois River.
Sample size was adjusted based on the variance from the previous
year (Table 1).
In 2004, we again revisited the sites selected in Pool 8 (except
for the 20 isolated backwater sites) in 2001 to continue to
monitor vegetation response to the drawdown. |
| |
Year 2005–Present: Sampling was conducted
in LTRMP key Pools 4, 8, and 13. |
| |
In 2005, a 5-year plan was developed for the LTRMP.
Within this plan, the data collection portion of the Program
was reduced to a level that could be accomplished annually
over the 5-year period given budget constraints. Under this plan based on guidance from the LTRMP
Analysis Team and Environmental Management Program Coordinating
Committee, the vegetation component will only conduct long-term
sampling in Pools 4, 8, and 13 (450 sites per pool) under the minimum sustainable
program.
In 2011, the sampling frame (i.e., map used to randomly draw sample sites) of Pool 13 was reduced permanently to eliminate a potential safety hazard to the field crew. The excluded area is part of the former Savanna Army Depot (now part of the Lost Mound Refuge). The reduced area eliminates 132 out of 13396 elements (i.e., potential sample sites) in the BWC and BWI strata in the frame. The summary statistics were recalculated for all previous years to reflect the sampling frame change by removing previous-year sites that fall in the removed portion of the frame.
Also, in previous years, standard deviations of the means were estimated using the Proc Surveymeans procedure of SAS in which standard deviations were adjusted down assuming our samples are from a finite population (For more details, see http://umesc.usgs.gov/ltrmp/stats/means.html#t7). We now abandon this correction because the "finite population" is an artifact of the grid system we used to select random sites. Hereafter standard deviations are estimated with the assumption that the samples are drawn from an infinite population.
In 2012, the summary statistics for Pool 4 were adjusted from representing the pool as an upper and lower half, divided in the middle of Lake Pepin (Figure A), to reflecting the data and the pool by its three geomorphic reaches (Thieling et al. 2000); upper Pool 4, Lake Pepin and lower Pool 4 (Figure B). |
 |
 |
|