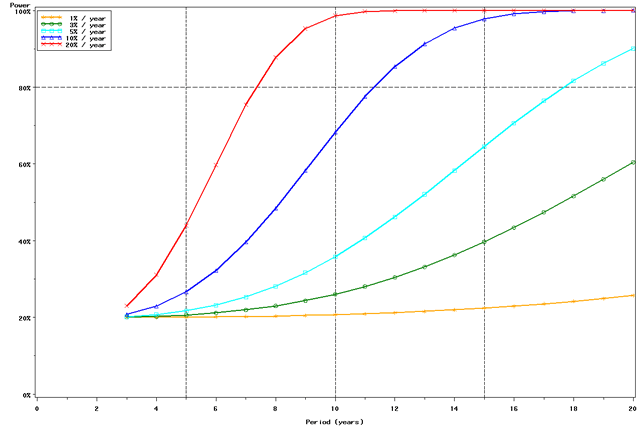
 Figure 3a: Estimated power to detect temporal trends in bluegill (Lepomis macrochirus) catch-per-unit effort (CPUE) in Pool 4 in all sampled strata (backwater, main channel border, wing dam, side channel strata) under half the present sampling intensity (n ≈ 41). Trends assumed exponential. The CPUE represents mean catch per 15-min effort. Estimates based on design-based, across-episode annual means. Note that halving the present sampling intensity for day electrofishing in Pool 4, without adjusting relative sampling intensities across strata, may lead to inadequate sample sizes for some strata. Figure 3a: Estimated power to detect temporal trends in bluegill (Lepomis macrochirus) catch-per-unit effort (CPUE) in Pool 4 in all sampled strata (backwater, main channel border, wing dam, side channel strata) under half the present sampling intensity (n ≈ 41). Trends assumed exponential. The CPUE represents mean catch per 15-min effort. Estimates based on design-based, across-episode annual means. Note that halving the present sampling intensity for day electrofishing in Pool 4, without adjusting relative sampling intensities across strata, may lead to inadequate sample sizes for some strata.
larger scale
|
Disclaimer: This information is provided
to help better inform ongoing LTRM partner discussions. The
power plots are generated from small sample sizes; all plots should be treated as approximate.
Contact: Questions or comments may be directed
to Brian Gray, LTRM statistician, Upper Midwest Environmental
Sciences Center, La Crosse, Wisconsin,
at brgray@usgs.gov.
|
