USGS - science for a changing world

Upper Midwest Environmental Sciences Center

folder Long Term Resource Monitoring Program
spacer tree Vegetation Data - Graphical Vegetation Database Browser

link to about veg component pagelink to help page

Frequency Metrics

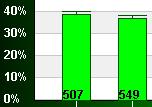
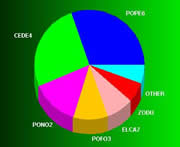
Two different frequency metrics are offered in the Vegetation Graphical Database Browser, Percent Frequency and Relative Frequency.

Percent Frequency
Percent frequency is a measure of how often a species is encountered. It is calculated by dividing the number of sites where a species occurs by the total number of sites sampled and multiplying by 100. It is displayed as a bar chart over a range of years. percent frequency chart
Relative Frequency
relative frequency chart Relative Frequency compares the frequency of one species to all species. It is calculated by dividing the number of occurrences for a single species by the total number of occurrences for all species. It is displayed as a pie chart representing one year.


Graphical Vegetation Home Page | About the LTRMP Veg Component | Help Page
Frequency | Abundance Index | Percent Cover | Distribution maps | Species List
Community Composition | Vegetation Species Information | Community Similarity | Diversity Index

Accessibility FOIA Privacy Policies and Notices

Take Pride in America logo USA.gov logo U.S. Department of the Interior | U.S. Geological Survey
URL: http://www.umesc.usgs.gov/data_library/vegetation/graphical/frequency_metrics.html
Page Contact Information: Contacting the Upper Midwest Environmental Sciences Center
Page Last Modified: December 31, 2012