
|
PSR 2002- 01 June 2002 Investigation of Remote Sensing Technology for Land Cover Acquisitionby Peter C. Joria,1 Larry R. Robinson,1 and Cynthia J. Berlin2 |
||||
|
To plan effectively, resource managers need current and cost-effective maps of the dynamic land cover/land use (LCU) types within the Upper Mississippi River System (UMRS) floodplain. In the past, the Upper Midwest Environmental Sciences Center (UMESC) produced these maps by interpreting 1:15,000-scale color-infrared aerial photographs to a 150-class, genus-based system. While this method generated land cover maps with unprecedented detail, it was time-consuming and expensive to do for the entire system. In 1998, this classification system was simplified to 31 classes that could still meet most analysis needs of UMRS resource managers. This significantly decreased the time needed to interpret photographs. In this study, we are investigating whether efficiency can be
further improved by changing the type of remotely sensed images
(aerial photographs, satellite scenes) used to produce floodplain
maps. We are evaluating three types of images. First, we are interpreting
aerial photography at a scale of 1:24,000 to determine what is lost
in accuracy and gained in efficiency when mapping at a smaller scale.
We are also examining the use of high spatial resolution (4-m) data
from a new commercial satellite (IKONOS). Finally, we will be evaluating
an airborne hyperspectral sensor (airborne imaging spectrometer
[AISA]). Hyperspectral sensors record energy over very narrow, but
contiguous, ranges of the electromagnetic spectrum. When particular
cover types have unique energy reflectance characteristics, computer
algorithms can be used to help distinguish between them, allowing
a more automated mapping process. The IKONOS and AISA sensors are
designed to help discriminate between cover types that are either
too limited in area or too similar in their reflectance characteristics
to have been mapped by previous sensors. Initial results indicated that the map based on 1:24,000 scale photography agreed with the reference data 55% of the time. The reference data was interpreted using a 1-acre minimum mapping unit (MMU), while an MMU of about 2 acres was used when interpreting the smaller-scale photography (Figure). Agreement between the two maps increased significantly (to 71% overall) when reference polygons smaller than 2 acres were excluded. The IKONOS classification agreed with the reference map 34% of the time. Accuracy or levels of agreement, such as these, are coarse metrics and should be viewed as relative measures. Reference data are rarely 100% accurate. In addition, inherent differences between photo-interpretation and automated classification make the two processes difficult to compare. However, these early results indicate that smaller scale aerial photography is more suitable than high-resolution satellite data for mapping the current LCU types.
Hyperspectral (AISA) and reference data (1:15,000 scale aerial photography) were acquired for the study area in Pool 8 in August 2001. Classification of the hyperspectral data will be done by a private contractor and assessed by the UMESC in late spring 2002. All phases of this study will be incorporated into a single report
in summer 2002. The report will address the strengths and weaknesses
of each approach, discuss probable causes of error, and recommend
the most efficient process for mapping the UMRS floodplain. |
||||
|
This report is a product of the Long Term Resource Monitoring Program for the Upper Mississippi River System. For further information, contact Peter C. Joria or Larry
R. Robinson Cynthia J. Berlin Project Status Reports (PSRs) are preliminary documents whose purpose is to provide information on scientific activities. Because PSRs are only subject to internal peer review, they may not be cited. Use of trade names does not imply U.S. Government endorsement of commercial products. All Project Status Reports are accessible through the Upper Midwest Environmental Sciences Center's website at http://umesc.usgs.gov/reports_publications/psrs/umesc_psr.html |
 (a)
(a)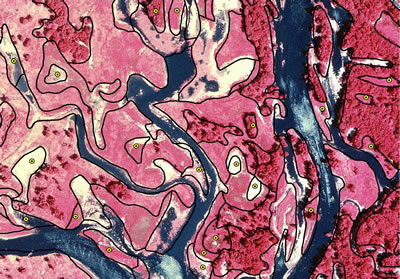 (b)
(b)Page Last Modified: April 17, 2018