|
The most widespread annual collections of benthic (bottom dwelling)
macroinvertebrates in the Upper Mississippi River System (UMRS)
are now being made as part of the Long Term
Resource Monitoring Program (LTRMP). Long-term monitoring is
necessary to better understand the conditions needed to support
viable macroinvertebrate populations at levels adequate to sustain
native fish and migrating waterfowl. In 1992, the long-term monitoring
of select taxa began in Pools 4, 8, 13, 26 and the Open River Reach
of the Upper Mississippi River and in La Grange Pool of the Illinois
River. Mayflies (Ephemeroptera), fingernail clams (Sphaeriidae),
and Asiatic clams (Corbicula sp.) were first selected for
sampling, followed by midges (Chironomidae) in 1993, and zebra mussels
(Dreissena polymorpha) in 1995.
|
|
 Mayflies,
fingernail clams, and midges were selected for monitoring because
they have traditionally been used as biological indicators of river
water quality and are important components of the aquatic ecosystem.
They perform the valuable ecological functions of digesting organic
material and recycling nutrients, in addition to being an important
food source for a number of waterfowl and fish species. The exotics,
Asiatic clams and zebra mussels, were chosen because of their potential
detrimental impact to the economy and biology of the UMRS. Mayflies,
fingernail clams, and midges were selected for monitoring because
they have traditionally been used as biological indicators of river
water quality and are important components of the aquatic ecosystem.
They perform the valuable ecological functions of digesting organic
material and recycling nutrients, in addition to being an important
food source for a number of waterfowl and fish species. The exotics,
Asiatic clams and zebra mussels, were chosen because of their potential
detrimental impact to the economy and biology of the UMRS.
Sampling was based on a stratified random design selected for estimating
mean densities of benthic macroinvertebrates within aquatic area
strata of each study area. Samples were collected yearly at approximately
125 sites per study reach using a winch-mounted standard Ponar grab
sampler designed for sampling macroinvertebrates from the substrate.
More than 4,000 Ponar collections were made from the six study reaches
during the summers of 1992, 1993, 1994, 1995, 1996, and 1997. No
statistically significant linear trend existed in the overall mean
densities of mayflies (P = 0.15), fingernail clams (P
= 0.22), or midges (P = 0.94) across years or the interaction
between study areas and year (P = 0.64, P = 0.94,
P = 0.24, respectively). However, the overall test for differences
in estimated mean densities of mayflies, fingernail clams, and midges
were statistically significant among study areas (P< 0.05).
|
|
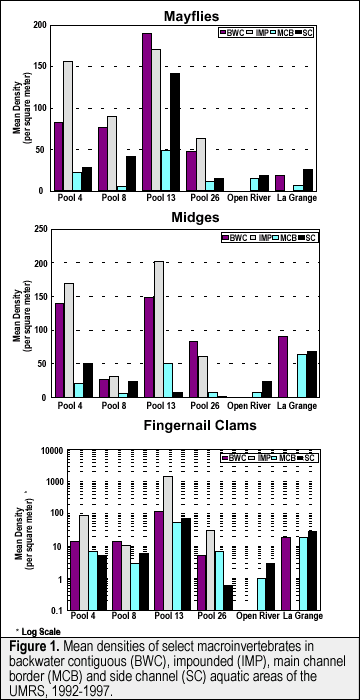
The mean densities of taxa varied over the years among aquatic
areas. Overall, the greatest densities of mayflies and midges were
found in the backwater contiguous and impounded aquatic areas of
Pools 4, 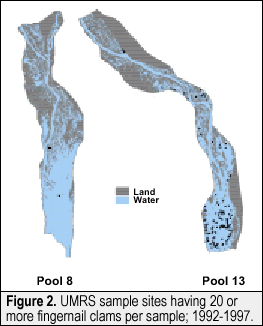 8,
13 and 26, including the naturally impounded Lake Pepin in Pool
4. The greatest densities of fingernail clams were observed in the
impounded aquatic areas of Pools 4, 13, and 26. However, in the
Open River Reach and La Grange Pool, the highest mayfly and fingernail
clam densities were found in the side channels (Figure 1). 8,
13 and 26, including the naturally impounded Lake Pepin in Pool
4. The greatest densities of fingernail clams were observed in the
impounded aquatic areas of Pools 4, 13, and 26. However, in the
Open River Reach and La Grange Pool, the highest mayfly and fingernail
clam densities were found in the side channels (Figure 1).
The densities of mayflies, fingernail clams, and midges captured
in LTRMP sampling are well within the ranges reported by past studies
on the UMRS. A previous study in the 1960's found density ranges
from zero to 1,114 per square meter (m-2 ) for Hexagenia
mayflies and from 237 m-2 to 7,570 m-2 for
fingernail clams in Pool 19. Fingernail clam populations in several
backwater lakes in Pool 9 varied from 631.8 m-2 in 1976
to 11.3 m-2 in 1989 and then increased to 78 m-2
in 1990. Midge densities greater than 4,000 m-2 were
found in a backwater lake in Pool 2 in the 1980's. Data from the
LTRMP sampling effort show density ranges from zero to 1615.4 m
-2 , 27,615 m-2 , and 4,000 m-2
for mayflies, fingernail clams, and midges; respectively.
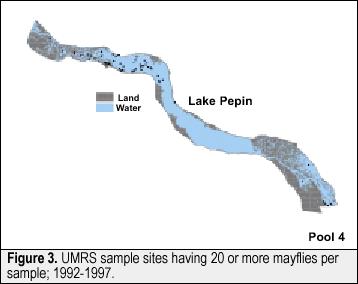 A
geographic information system (GIS) is being used to view and analyze
the LTRMP spatial data.The integration of monitoring data with spatial
databases will assist scientists in determining spatial distributions
and help explain causal relationships.Although the integration of
monitoring data and spatial databases is just beginning, simple
mapping of the numbers of taxa from Ponar sampling vividly shows
the spatial distribution within a study area and differences among
study areas (Figures 2 and 3). A
geographic information system (GIS) is being used to view and analyze
the LTRMP spatial data.The integration of monitoring data with spatial
databases will assist scientists in determining spatial distributions
and help explain causal relationships.Although the integration of
monitoring data and spatial databases is just beginning, simple
mapping of the numbers of taxa from Ponar sampling vividly shows
the spatial distribution within a study area and differences among
study areas (Figures 2 and 3).
|
|
This report is a product of the Long Term
Resource Monitoring Program for the Upper Mississippi River
System.
For further information, contact
Jennifer S. Sauer
U.S. Geological Survey
Upper Midwest Environmental Sciences Center
575 Lester Avenue
Onalaska, Wisconsin 54650
Phone: 608/783-7550, ext. 64
E-mail: Jennie_Sauer @usgs.gov
Dr. Kenneth S. Lubinski
U.S. Geological Survey
Upper Midwest Environmental Sciences Center
575 Lester Avenue Onalaska, Wisconsin 54650
Phone: 608/783-7550, ext. 61
E-mail: ken_lubinski@usgs.gov
Project Status Reports (PSRs) are preliminary documents whose purpose
is to provide information on scientific activities. Because PSRs
are only subject to internal peer review, they may not be cited.
Use of trade names does not imply U.S. Government endorsement of
commercial products.
All Project Status Reports are accessible through the Upper Midwest
Environmental Sciences Center’s website at http://umesc.usgs.gov/reports_publications/psrs/umesc_psr.html
|
