
|
PSR 97-07 July 1997 Vegetation Response to a Water Level Experiment |
|
By Joseph H. Wlosinski,1 James T. Rogala,1 Thomas W. Owens,1 Kenneth L. Dalrymple,2 David Busse,3 Claude N. Strauser,3 and Elmer Atwood4 |
|
The Saint Louis District, U.S. Army Corps of Engineers (COE), has been experimenting with water levels on Pools 24, 25, and 26 since 1994. The experiment is being performed in cooperation with the Pool 25 Natural Resources Management Committee, an interagency group dedicated to improving habitat in the Upper Mississippi River floodplain. The experiment was thought to be successful in 1994 although little quantitative data were obtained. The COE agreed to continue the experiment if discharge was within the proper range during 1995, with vegetative response monitoring being performed by the Missouri Department of Conservation and the Environmental Management Technical Center. |
|
All three pools were managed to improve vegetative production.
Recommendations from the Committee called for holding water levels
on the low side of the operating band for at least 30 days during
late spring or summer. |
|
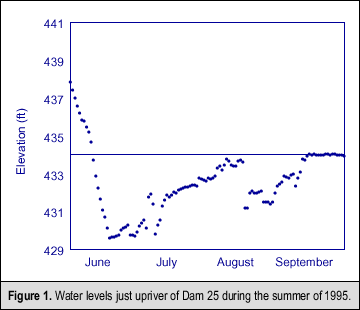
Twenty vegetation surveys were performed at 8 areas: Crider Island, Pharrs Island and Clarksville Refuge in Pool 24; Stag Island, Jim Crow Island, Turner Island and Batchtown in Pool 25; and Dresser Island in Pool 26. Three points were established at each of the 20 sites, each with an elevation difference of 0.5 ft. At each point, a 0.5m quadrate was estab lished to record plant species and the number and height of individuals. In addition, photographs were taken at each site during weekly visits. Seven plant genera were identified in the 20 survey sites: Polygonum spp. (Smart-weed, found at 45 % of the sites); Cyperus spp. (Chufa, 75%); Echinochloa spp. (Wild Millet, 80%); Amaranthus spp. (Pigweed, 30%); Setaria spp. (Yellow Foxtail, 10%); Panicum (15%); and, Leersia (Rice Cutgrass, 20%). Approximately 30 days were required for plants to grow to a height of 7-10 inches during the summer of 1995. Plants then grew more quickly as water levels were slowly raised. Of the three dominant plants, Chufa reached a height of 35 inches during the last sampling period, while Wild Millet and Smartweed were approximately 40-45 inches at that time. |
|
|
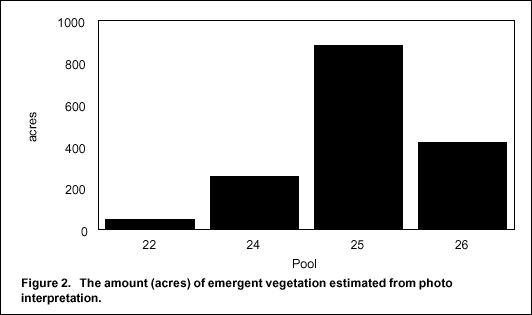
We obtained aerial infrared photographs (1:15,000 scale) on July 27, 1995, for the lower stretches of the three pools where water levels were held lower than normal and for Pool 22 where no drawdown occurred. These photographs were interpreted using the standard Long Term Resource Monitoring Program vegetation classification system, specifically searching areas near the water line that had signatures representing the above plants. The estimate of plants from photo interpretation for eight-mile stretches just upriver of the dams is shown in figure 2. In Pools 24 through 26, between 255 and 880 acres of plants were measured near the water line compared to just 51 acres in Pool 22, which was not managed to provide additional vegetative growth. The acreage figures may be underestimated because vegetation swaths under 2 m wide were generally not included. The environmental pool management experiment conducted by the COE in conjunction with the Pool 25 Natural Resources Management Committee is an example of how environmental and navigation goals can be met. The authors believe that this coordinated water level management experiment represents a step toward ecosystem management on the Upper Mississippi River System. For their part in the experiment, the St. Louis District won the 1997 Mississippi River Restoration award presented by American Rivers, a national river conservation group based in Washington, D. C. |
|
1Upper Midwest Environmental Sciences Center |
|
This report is a product of the Long Term Resource Monitoring Program for the Upper Mississippi River System. For further information, contact Joseph H. Wlosinski Project Status Reports (PSRs) are preliminary documents whose purpose is to provide information on scientific activities. Because PSRs are only subject to internal peer review, they may not be cited. Use of trade names does not imply U.S. Government endorsement of commercial products. All Project Status Reports are accessible through the Upper Midwest Environmental Sciences Center’s website at http://umesc.usgs.gov/reports_publications/psrs/umesc_psr.html |
 After
this period the pool would be raised at a rate not greater than
0.2 ft per day.
After
this period the pool would be raised at a rate not greater than
0.2 ft per day.Page Last Modified: April 17, 2018