| Sampling procedures were described in detail in Yin
et al. (2000). The following is a brief description of the overall
design.
|
|
Stratification
|
| Sampling sites were distributed in shallow water areas where
water depth was less than or equal to 3 m deep at flat-pool condition
in 1998. After 1998, sampling sites were distributed in less than
or equal to 2.5 m deep at flat-pool condition. Deeper water areas
most likely do not support aquatic vegetation. Shallow water areas
were divided into general habitat types (strata), including main
channel borders, secondary channels, contiguous backwaters, isolated
backwaters, and impounded areas. Sampling efforts were generally
proportional to acreage and perceived habitat heterogeneity of each
stratum, except for the isolated backwater areas whose sampling
sizes were kept small to ensure a timely completion of the investigation.
Some areas were excluded from the sampling areas because of safety
concerns and accessibility difficulties. |
|
Site Selection
|
| Sites to be investigated were selected on a computer using a
random number generator. A 50- X 50-m grid was generated and overlaid
onto the stratified aquatic areas. Nodes of the grid were geo-spatially
registered (Universal Transverse Mercator coordinates), and nodes
that fell in the sampling strata were eligible for selection as
sites. We navigated to the general area of a site using an enlarged
hard-copy map and then switched to global positioning system (GPS)
equipment with differentially corrected signals as the boat approached
the targeted location. The boat was anchored at bow and stern when
both the easting and northing coordinates displayed on the GPS unit
were within 10 m (- or +) of their respective target readings. The
actual GPS coordinates were read and recorded twice at each site,
once immediately after the boat had been anchored and again before
the boat was released for departure. |
|
Equipment and Definitions
|
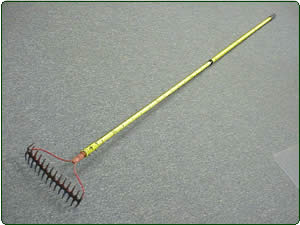
| Submersed aquatic vegetation was collected
using a long-handled, double-headed rake modified from Jessen
and Lound (1962) and Deppe and Lathrop (1992). The rake is
36 cm (14 inches) wide, has 14, 5 cm (2 inches) long teeth
on each side, and was made by welding two square-headed garden
rakes together. The teeth are divided and marked into five
equal parts (or 20% increments). The handle is about 3 m long,
with a rope extension, and is scaled at 10-cm increments.
Aquatic vegetation or aquatic species refer to the following
plant types or life forms: submersed (S) and rooted floating–leaf
(F). |
 |
|
|
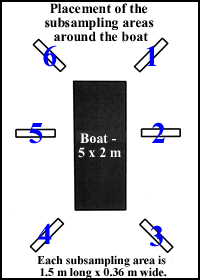
The Site and Subsampling Areas
|
|
Each site had six subsampling areas, each of which was a rectangular
area approximately 1.5 m long and 0.35 m wide (the width of
the rake head). One subsampling area was located off each
corner of the boat and the other two were located, one each,
off the left and right sides.
|
|
|
Sampling and Data Recording
|
| Individual species and different
life forms of aquatic vegetation (e.g., submersed and rooted
floating–leaf) were recorded as either present or absent
at each subsampling area based on visual examination and a
rake sample. When present, submersed species and the filamentous
algae were given a density rating (see table at
lower left) based on their thickness on the rake teeth.
When present, rooted floating–leaf and emergent species
were given a percent cover rating (see table at
lower right). Species that had not been recorded in the
six subsampling areas but were observed at the site were recorded
and marked as "additional species." Fassett (1957),
Voss (1972, 1985) and Gleason and Cronquist (1991) were the
primary references used for plant identification. Scientific
nomenclature and common names are based on those found in
the U.S. Department of Agriculture's PLANTS Database on the
Internet (http://plants.usda.gov/). |
| Submersed vegetation
density ratings |
| Percent of rake teeth filled |
Density rating |
| 81-100 |
5 |
| 61-80 |
4 |
| 41-60 |
3 |
| 21-40 |
2 |
| 1-20 |
1 |
| no plants retrieved |
0 |
|
| Rooted floating–leaf
vegetation
cover ratings |
| Percent of area covered |
Cover rating |
| 81-100 |
5 |
| 61-80 |
4 |
| 41-60 |
3 |
| 21-40 |
2 |
| 1-20 |
1 |
| none |
0 |
|
|
|
Computation of Summary Indexes
|
| Frequency |
| Frequency values in this report are computed by dividing
the number of sites where a species was recorded by the number
of sites investigated in the stratum, and then multiplied
by 100 to convert it into a percentage.
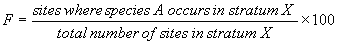 .
.
The frequency value in a pool is computed by averaging the
frequency values of the shallow water strata, weighted by
acreage:
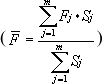 where Fj is the frequency in stratum j
and Sj is the acreage of stratum j.
where Fj is the frequency in stratum j
and Sj is the acreage of stratum j.
|
| Abundance Index |
| An index is created to measure the quantity of a submersed
species using both presence or absence and plant density rating
data recorded in the six subsampling areas. We call it the
abundance index to differentiate it from the frequency index.
The abundance index is computed according to the following
formula:
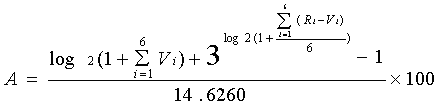
where Vi is the presence or absence (1,0)
and Ri is the plant density ranking (0,1,2,3,4,5)
data for the ith subsampling areas at the
site (i=1,2,3,4,5,6). Data are treated before computation
so that Vi=1 if Ri>=1
and, vice versa, Ri>=1 if Vi=1.
The abundance index for a stratum is computed as the simple
average of all its sites 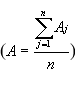 .
The abundance index for a pool is computed as the average
of all shallow water strata, weighted by acreage: .
The abundance index for a pool is computed as the average
of all shallow water strata, weighted by acreage:
 where Aj is the abundance index of the species
in stratum j and Sj is the acreage
of stratum j.
where Aj is the abundance index of the species
in stratum j and Sj is the acreage
of stratum j. |
| Percent Cover (Rooted floating–leaf life form) |
| The percent cover of rooted floating–leaf
life forms in a stratum is computed using the following formula:
 where Lj is the cover rating at individual
sites and A is the midpoint of the corresponding percent cover
(Table 3), and M is the total number of sites in the stratum.
Percent cover in a pool is computed as the average of all
shallow water strata, weighted by acreage:
where Lj is the cover rating at individual
sites and A is the midpoint of the corresponding percent cover
(Table 3), and M is the total number of sites in the stratum.
Percent cover in a pool is computed as the average of all
shallow water strata, weighted by acreage:
 where Cj is percent cover in stratum j
and Sj is the acreage of stratum j.
where Cj is percent cover in stratum j
and Sj is the acreage of stratum j.
|
|
