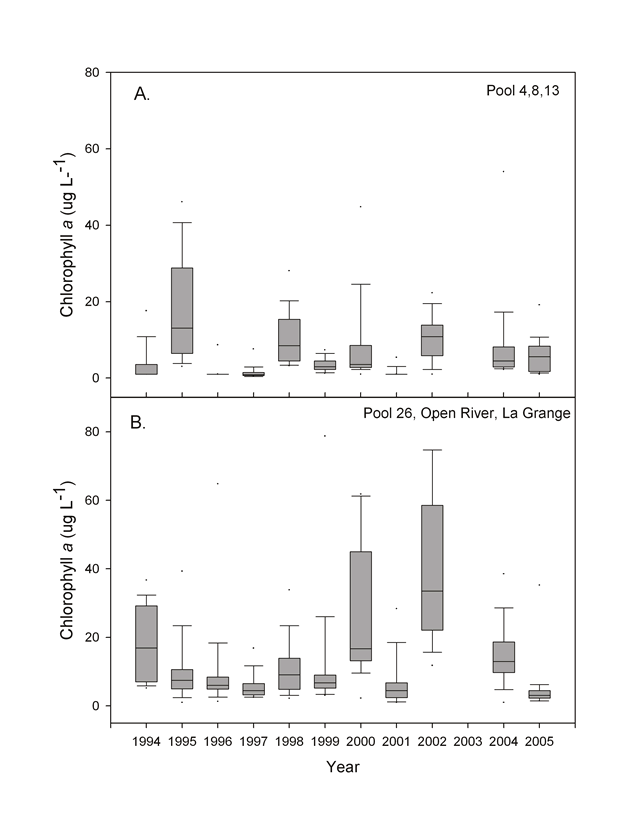
| Figure 7. | Chlorophyll-a concentrations (µg/L) in the Mississippi River at (A) northern and (B) southern Long Term Resource Monitoring Program study areas in winter random sampling, Upper Mississippi River System, 1994–2005. Data are from all strata. No stratified random sampling data were collected in 2003. The boundary of the box closest to zero indicates the 25th percentile, a line within the box marks the median, and the boundary of the box farthest from zero indicates the 75th percentile. Whiskers (error bars) above and below the box indicate the 90th and 10th percentiles. |
 |
|
Page Last Modified: April 17, 2018

