
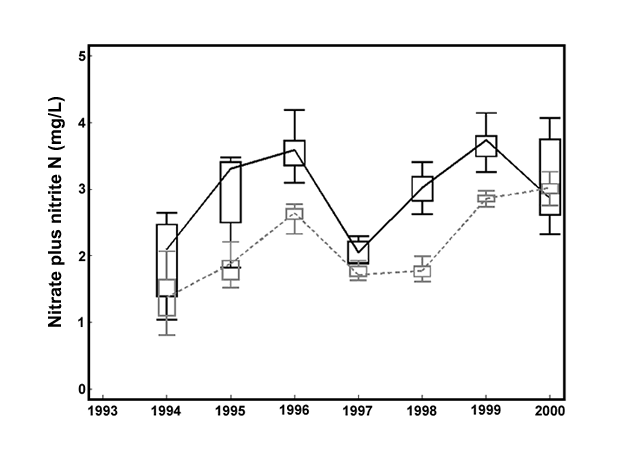
| Figure 5. | Nitrate plus nitrite (mg/L) concentrations in Pool 26 (solid line) and Open River (dashed line) during summer stratified random sampling. An upward trend (0.2 mg/L per year) is statistically significant (P < 0.001) at both locations. Open River concentrations are slightly lower, probably because of dilution by the Missouri River, which enters the Upper Mississippi River immediately below Pool 26. |
 |
|
Page Last Modified: April 17, 2018