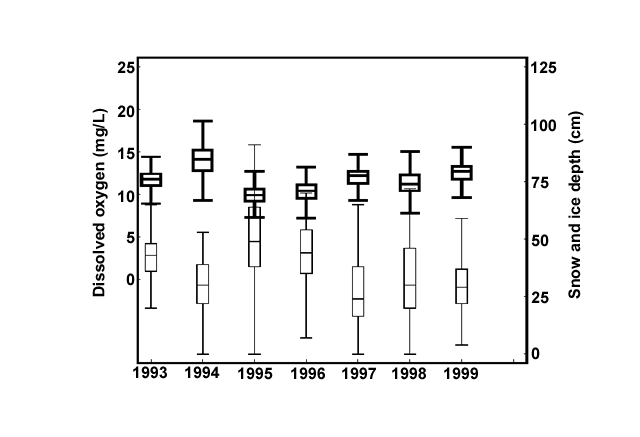
| Figure 3. | Dissolved oxygen concentration (bold) and combined snow and ice depth during winter stratified random sampling in Pools 4, 8, and 13. The years correspond to the start of the winter season rather than the sampling date. Because ice and snow reduce light penetration and oxygen production under the ice, these two patterns tend to be mirror images. There have been statistically significant trends in both oxygen concentration and snow and ice cover since winter of 1995–1996. |
 |
|
Page Last Modified: April 17, 2018

