|
|

HNA Summary Report
Forecast
Future Condition
|
|
 Quantitative
Geomorphic Change Quantitative
Geomorphic Change
The plan form features of the UMRS are quite stable and are not projected
to change much in absolute area over the next fifty years. The projected
changes for all the pools along the UMR include a prediction that total
water area will decrease by only 1.4 percent by the year 2050. The area
of aquatic area classes is predicted to change as follows:
- contiguous backwaters decrease by 2.1%;
- isolated backwaters decrease by 3.6%
- main channel decreases by 0.7%;
- secondary channels decrease by 2.6%;
- island area decreases by 2.0%.
|
|
Island loss is largely due to island erosion predicted to occur in Reach
3. For many other reaches, the area of islands actually increases. Overall,
the total perimeter of islands is predicted to decrease by 3.7%. The acreage change predictions should not be considered to be precise
estimates of change, but should rather be considered as indicators of
the types and general amounts of changes likely to occur in the future.
Also, it must be emphasized that the predictions include changes in surface
area only, and do not account for many factors that affect habitat quality.
The acreage change predictions should not be considered to be precise
estimates of change, but should rather be considered as indicators of
the types and general amounts of changes likely to occur in the future.
Also, it must be emphasized that the predictions include changes in surface
area only, and do not account for many factors that affect habitat quality.
The Cumulative Effects Study projected geomorphic change for much of
the UMRS and concluded that Reach 3 (Pools 5-9) has been and is predicted
to continue to be dominated by island erosion. Reach 3 (Pools 5-9) is
the only reach where total open water area is expected to increase. This
is due to the predicted continued erosion of islands in the reach. In
all other reaches, total water area is expected to decrease, including
both isolated and contiguous backwater areas.
|
|
Reaches 4 through 10 (Pools 10 – Open River) have all experienced
loss of contiguous backwater, especially reaches 6 through 10 (Pools
18 – Open River) where loss of isolated backwater has also
been occurring. Generally, both of these processes are expected
to continue for these reaches.
|
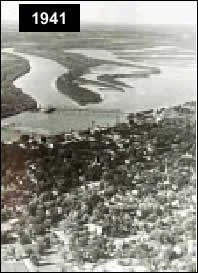 |
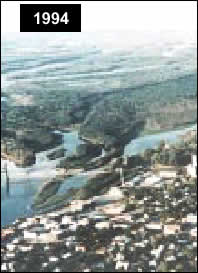
These photos of Muscooten Bay near Beardstown, Illinois dramatically
demonstrate the high sedimentation rate in the Illinois River Valley.
Thousands of acres of backwaters have been lost or degraded. (photos:
Illinois Natural History Survey – Illinois River biological
Station)
|
 |
|
|
Geomorphic Change Processes
The Cumulative Effects Study identified 58 locations in pools 4 through
26 influenced by one or more of nine geomorphic processes. Consultations
with resource managers yielded an additional 347 areas in the same reach
and an additional 125 areas in Pools 2-3, the Open river, and the Illinois
River. A total of 530 areas expected to change were plotted on maps (Fig.
26; Table 5).
|
|
Fig. 26. Resource managers identified areas expected to change throughout
the UMRS similar to this example from Pool 7 near La Crosse, Wisconsin.
|
Table 5. Projected UMRS geomorphic change.
| Geomorphic Process |
Number of Occurrences
|
| Channel Formation |
3
|
| Delta Formation |
3
|
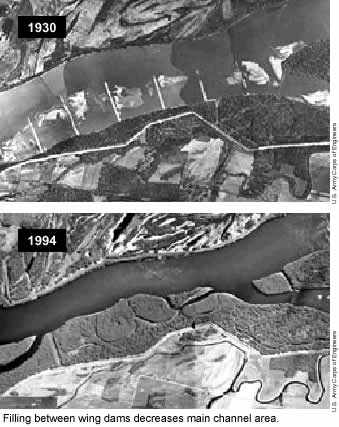
| Filling between Wing Dams |
34
|
| Island Dissection |
15
|
| Island Formation |
20
|
| Island Migration |
4
|
| Loss of Contiguous Impounded |
9
|
| Loss of Bathymetric Diversity |
12
|
| Loss of Continguous Backwaters |
153
|
| Loss of Isolated Backwaters |
49
|
| Loss of Cont/Iso Backwaters |
32
|
| Loss of Secondary Channels |
116
|
| Loss of Tertiary Channels |
5
|
| Shoreline Erosion |
8
|
| Tributary Delta Formation |
43
|
| Wind-Wave Erosion of Islands |
25
|
|
|
Floodplain Vegetation Succession
Open water and scrub-shrub habitats are projected to decline. No change
is predicted for grassland, agriculture, and developed area. Small increases
are projected for wet meadow. Rather large changes are projected for early
successional stage communities (i.e., willows and cottonwoods). Increased
sand-mud is due to loss of open water area. The simple rule-based terrestrial
vegetation successional model probably overestimates the amount of early
successional species likely to occur on the UMRS.
Table 6. Land cover class change predicted by the UMRS terrestial
vegetation successional model.
| HNA Class |
Total Existing Acres
|
Predicted Change (acres)
|
Predicted Change (percent)
|
| 1. Open Water |
452,587
|
–33,095
|
–7.3
|
| 7. Seasonally Flooded Emergent |
3,750
|
4,281
|
114.2
|
| 8. Wet Meadow |
38,449
|
10,389
|
27.0
|
| 9. Grassland |
54,454
|
0
|
0.0
|
| 10. Scrub/Shrub |
34,393
|
–14,142
|
–41.1
|
| 11. Salix Community |
6,357
|
14,418
|
226.8
|
| 12. Populus Community |
3,294
|
6,277
|
190.6
|
| 13. Wet Floodplain Forest |
378,282
|
–6,376
|
–1.7
|
| 14. Mesic Bottomland Hardwood Forest |
17,989
|
14,402
|
80.1
|
| 15. Agriculture |
1,166,691
|
0
|
0.0
|
| 16. Developed |
147,277
|
0
|
0.0
|
| 17. Sand/Mud |
6,308
|
4,640
|
73.6
|
| 18. No Photo Coverage |
207,808
|
0
|
0.0
|
|


