

Upper Midwest Environmental Sciences Center
Graphical Water Quality Database Browser Help Page - Stratified Random Sampling
Note: a separate graphical browser is available for LTRMP fixed site sampling data.
Help Topics
For more information on the Long Term Resource Monitoring Program (LTRMP) Water Quality Component monitoring procedure: LTRMP Procedures: Water Quality Monitoring
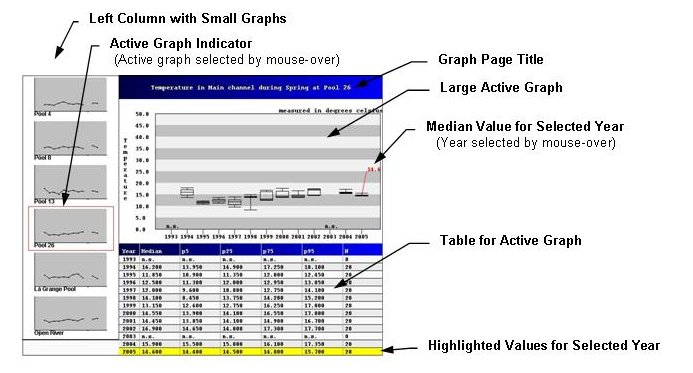
Help Using Graphical Water Quality Database BrowserAbout the Graphical Water Quality Database BrowserThe graphing software used for the Graphical Water Quality Database Browser was written using Java Applet technologies. To work on your computer, your Web browser must have java enabled. The graphing software displays a number of graphs to compare seasons, reaches, or strata at the same time. The user then can choose one of the graphs to be displayed in more detail in the main window. The details are in the form of a box plot and a table containing the values in the box plot. Although LTRMP will take bottom and mid-depth samples at some sites for some parameters, all values reported in this browser are for surface samples. Using the Graphical Water Quality Database Browser
Above is a display of output from the graphing tool. The display is divided into two regions, the left column and the main window. In the left column, small graphs (one for each season, reach, or stratum) are displayed. The main window displays the active graph and its associated data table. To change the active graph, point the mouse arrow at the smaller version of the graph in the left column. This will highlight the chosen graph, displaying it in the main window. To see a numerical value on the graph in the main window, use the mouse to point to the location on the graph that you want to see the value for, or point to a specific year or value in the table. Enabling Java in Netscape and Internet Explorer Internet Explorer
Netscape Navigator
|
Help With Reaches
All LTRMP study reaches (Pool 4, Pool 8, Pool 13, Pool 26 and an Open River reach on the Upper Mississippi River, and the La Grange Pool on the Illinois River) are sampled for water quality. A more detailed description of these study reaches can be found at: Study Reaches. It should be noted that each reach is sampled within strata, and we provide graphical summaries only for strata and not the reach as a whole.Help With Strata
The LTRMP stratifies water quality sampling across five strata, characterized
by enduring geomorphic and physical features(Wilcox
1993). The LTRMP water quality sampling strata are defined as follows:
Main Channel
Aquatic areas of the main navigation channel and adjacent channel borders extending to the nearest shoreline.
Side Channel
This stratum includes both secondary and tertiary channels. These channels may or may not have terrestrial margins, but have measurable current velocities at normal water elevations. This differs from the LTRMP fish sampling stratum definition, as fully submerged secondary or tertiary channels that do not have terrestrial margins (such as may occur in impounded areas above dams) are not considered side channels for fish sampling.
Backwater Contiguous
Backwater contiguous is characterized by having some connection by water to the main navigation channel, but are separated from the main channel by a terrestrial area and carry little flow at normal river elevations. Backwaters may consist of floodplain depression lakes, sloughs, lateral levee lakes, bays, and artificial lacustrine areas.
Impounded
Impounded areas are large, mostly open-water areas located immediately upriver from locks and dams. Water elevations are held higher than pre-impoundment levels by the dams. Impounded areas may contain many areas that were terrestrial before impoundment.
Other
There are two large lakes that are sampled as separate strata. In Pool 4, Lake Pepin is a deep lake formed by the delta of the Chippewa River. In Pool 26, Swan Lake is a highly managed shallow lake connected to the Illinois River near the Mississippi River.
Help With Water Quality Variables
The LTRMP currently samples, or has sampled in the past, many water quality characteristics. The browser only graphs 14 selected variables that are typically of most interest to users. A more detailed description of the variables can be found in the LTRMP Procedures Manual.
Temperature
Water temperature for the sample measured in degrees Celsius.
Dissolved Oxygen
Amount of Dissolved Oxygen in the sample. Measured in milligrams/liter.
Conductivity
Conductivity (ability of the water to conduct an electric current) measurement for the sample. Measured to the nearest uS/cm.
pH
pH measurement for the sample. Measured in pH units.
Turbidity
Turbidity (water clarity) measurement for the sample. Measured in nephelometric turbidity to the nearest whole nephelometric techniques.
Suspended Solids
The total particulate material trapped by a glass fiber filter and dried at 105 degrees Centigrade. Reported as milligrams per liter.
Volatile Suspended Solids
The weight loss on combustion at 500 - 500 degrees Centigrade of the total suspended solids residue for the sample. Reported in milligrams per liter.
Chlorophyll
Calibrated fluorometric chlorophyll. Values calibrated using specific calibration factors from the concentration of photosynthetic pigment chlorophyll-a, corrected for phaeophytin as determined by the spectrophotometric technique using 90% acetone extraction. Approximate calibration equation is: Chlorophyll a = 1.9 + 0.9####FL1. Units of Chlorophyll and FL1 are both micrograms per liter.
Total Nitrogen
The total nitrogen concentration (dissolved and particulate) in the sample. Reported as milligrams of nitrogen per liter.
Nitrate Nitrite
The total amount of nitrate plus nitrite for the sample. Measured in milligrams of nitrogen per liter.
Total Phosphorus
The total amount of phosphorus (dissolved and particulate) in the sample determined using persulfate digestion. Reported as milligrams of phosphorus per liter.
Soluble Reactive Phosphorus
Soluble reactive phosphorus measurement for the sample. Reported as milligrams of phosphorus per liter.
Ice Thickness
Vertical thickness of ice. Only the portion of the frozen block that represents the water column within the ice block is measured as ice depth. Reported in centimeters.
Snow Depth
Vertical thickness of snow on the ice reported in centimeters.
URL: http://umesc.usgs.gov/data_library/water_quality/graphical/wtr_help.html
Page Contact Information: Contacting the Upper Midwest Environmental Sciences Center
Page Last Modified: December 31, 2012