
Program SUBSAMPL/HABUSE: Integrating SAS and GIS software to improve habitat use estimates from radiotelemetry data
Kevin P. Kenow, Upper Midwest Environmental Sciences
Center
Robert G. Wright, Wisconsin Department of Natural Resources
Michael D. Samuel, National Wildlife Health Center
Paul W. Rasmussen, Wisconsin Department of Natural Resources
- Download - 146 kb .zip file
The software package includes a user's guide, 2 SAS program
files,
sample data files, and a ARC/INFO AML with numerous associated files.
Please direct questions and comments to Kevin Kenow
Determination of habitat use patterns is a common practice for wildlife radiotelemetry studies. However, habitat misclassification and precision of habitat use must be considered because the true location of a radiomarked animal can only be estimated. Kenow and Samuel (1992: Journal of Wildlife Management 56:725-734) presented analytical methods that considered the estimated location of the animal and the potential misclassification of habitat use to provide improved estimates of habitat use.
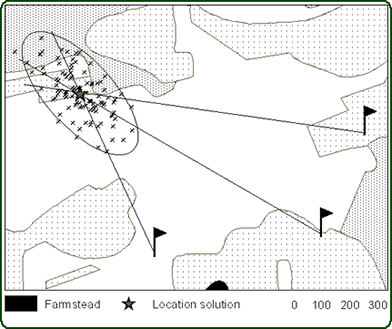
We developed software, based on these methods, to conduct improved habitat use analyses. The proportion and precision of habitat types used is calculated from the subsample of points generated for each radiotelemetry location (Figure 1).
 |
|
| Figure 1: Relationship among 95% error ellipse, 100 subsample points, and location solution (in crop field) for a radiomarked female wild turkey on 6 September 1989, Vernon County, Wisconsin. In this example, 26% of the random subsamples fall in crop fields, 18% fall in woodlands, and 56% fall in pasture. |
|
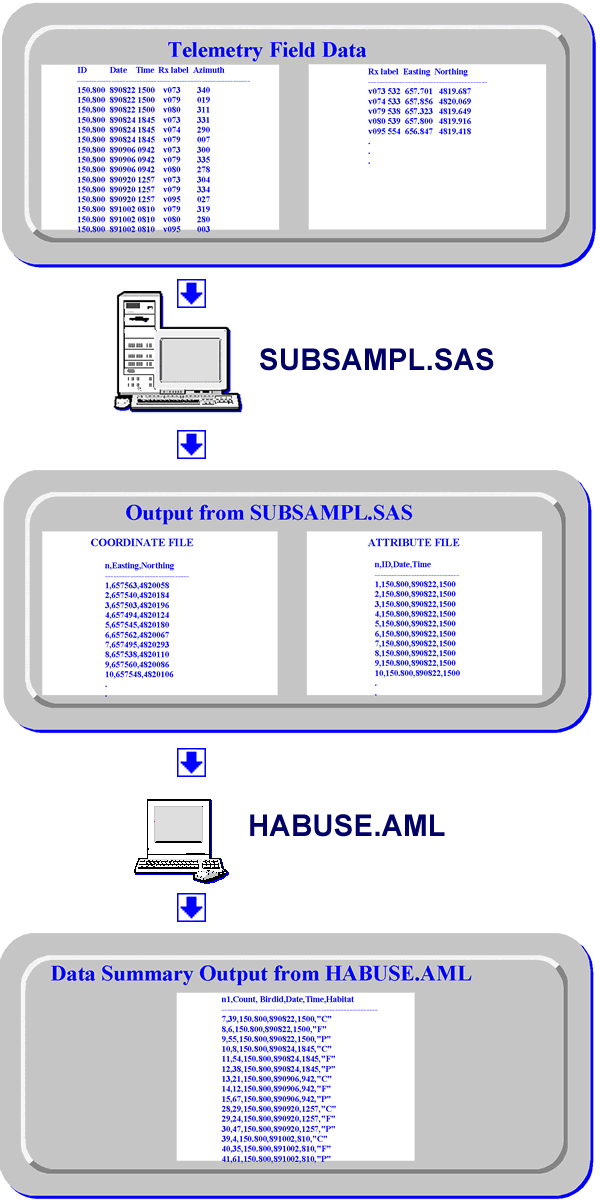
A SAS-executable file generates a random subsample of points from the error distribution of an estimated animal location and formats the output into ARC/INFO-compatible coordinate and attribute files (Figure 2). An associated ARC/INFO AML (Figure 3) creates a coverage (digital map) of the random points, determines the habitat type at each random point from an existing habitat coverage, sums the number of subsample points by habitat type for each location, and outputs the results in ASCII format. We illustrate the method and software by analysis of radiotelemetry data for wild turkey hens. This software should have broad application in radiotelemetry studies of habitat use patterns. Download - 146 kb .zip file |
|
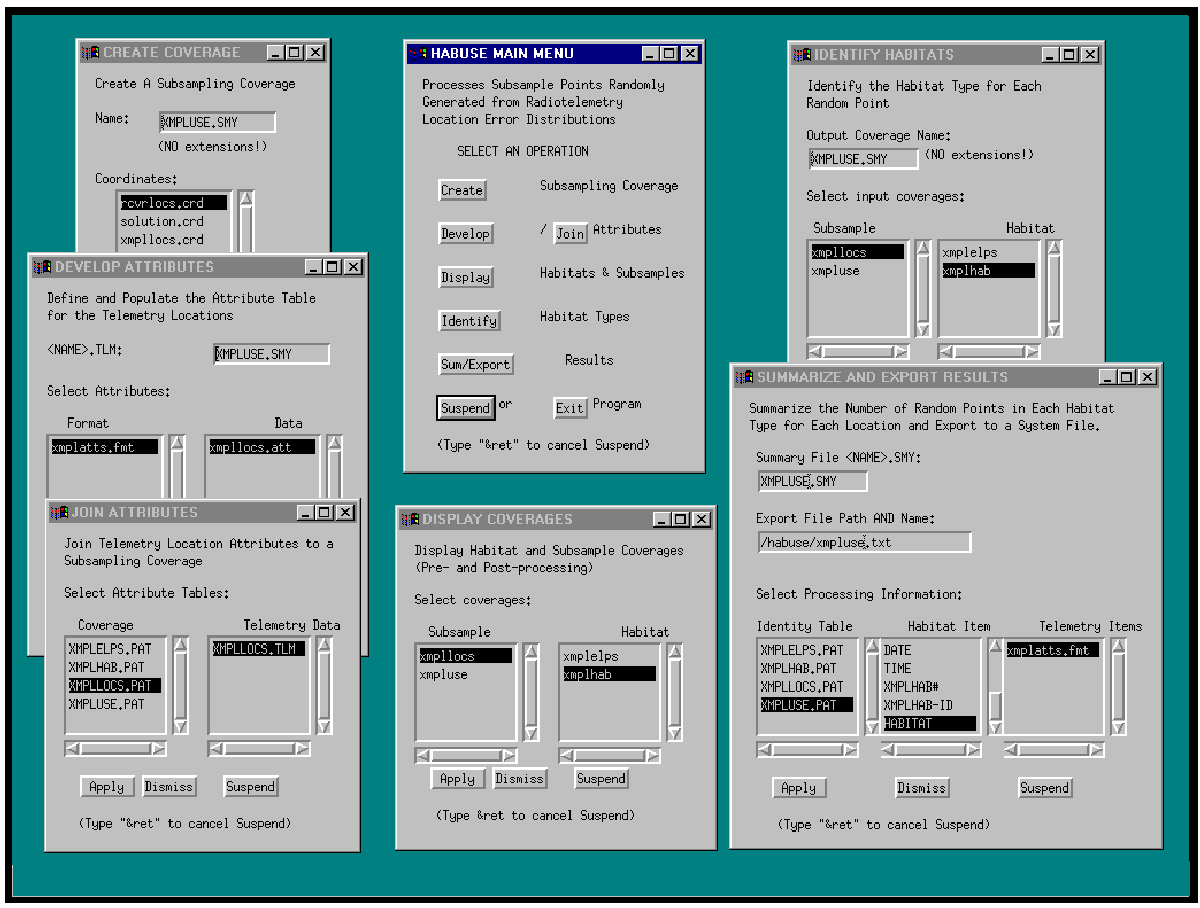 |
| Figure 3: Processing and display menus for HABUSE.AML. |
Page Last Modified: April 17, 2018