USGS - science for a changing world

Upper Midwest Environmental Sciences Center

Avian Conservation Ecology

Population Demographic Models for the Conservation of Endangered Indiana Bats at Risk to White-Nose Syndrome

Principal Investigator: Wayne Thogmartin

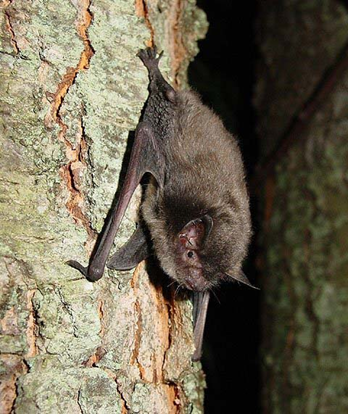
Bats are nocturnal, flying mammals that eat insects or fruits, pollinate flowers, distribute seeds, and are important to many ecosystems. Across North America there are 45 species of bats, many of which are threatened or endangered. One species of federally endangered bat, the Indiana bat (Myotis sodalis), is a medium-sized, gray, black, or chestnut brown bat living primarily in eastern, midwestern, and parts of the southern United States. Reasons for the bat's decline include disturbance of colonies by humans, pesticide use, and loss of summer habitat resulting from the clearing of forest cover.

Recently, a potential range-wide threat to Indiana bat survival is caused by white-nose syndrome, a disease named after a white fungus (Geomyces destructans ) found growing on the muzzles, ears, and wings of some afflicted bats. White-nose syndrome was first discovered in winter 2006 at Howe’s Cave, New York, near the northeastern edge of the species’ winter range. Mortality rates may exceed 75% for hibernacula (places where bats hibernate) affected by this syndrome. Since its discovery, white-nose syndrome has spread to many more hibernacula (see animation below, Nowcasting the emergent spread of White-nose Syndrome in Indiana bats Powerpoint poster Thogmartin et al., In press), severely reducing bat populations. The loss of 18,662 Indiana bats from white-nose syndrome in 2008 alone represented a loss of ~4% of the range-wide population. This novel threat increases the urgency for understanding the population dynamics of this endangered species. Unfortunately, there is a scarcity of population characteristics or demographic information for the Indiana bat and no models have been devised for this species.

A Need for More Information

The U.S. Fish and Wildlife Service, a federal agency responsible for this endangered bat, would like to be able to predict the consequences of alternative actions for the conservation and recovery of the Indiana bat, but at this time, an appropriate population model is not available. The goal of this study was to develop models and software for allowing recovery coordinators and associated agency biologists to predict the consequences of alternative management scenarios.

Science Impact

The model, associated software, and user’s guide will be available for download from the Upper Midwest Environmental Sciences Center’s website (www.umesc.usgs.gov). The model will allow natural resource professionals to evaluate the Indiana bat population dynamics and impacts of white-nosed syndrome in the context of conservation and restoration decision making and management options.

Indiana Bat
Indiana bat (Myotis sodalis)
Photo Credit: Adam Mann, Environmental Solutions and Innovations - FWS database

Get Adobe Flash player


Two-Stage Dynamic Model

To adequately model Indiana bat populations a panel of species experts and endangered species biologists were gathered to identify key demographic characteristics determining the population dynamics of this species (Szymanski et al. 2010). The matrix model is comprised of two stages, adult and juvenile females. Transitions include whether the individual reproduces, is successful at reproducing, and survives winter, summer, and fall. Pups survive at a particular rate before entering the hibernaculum, thus becoming juveniles. The development of this model occurred in four steps or stages. Model prototypes focused on individual and multiple hibernacula, as well as point estimates and a range of variation in population characteristics (Figure 1).

We developed the model prototypes in Matlab R2009a (Mathworks, Natick, MA), and by Stage 4, converted to a GUI interface written in the freeware R (R Development Core Team, Vienna, Austria). The final model runs parallel model scenarios, allowing an explicit assessment of the differences between management scenarios. A user is able to provide two sets of input values for the model parameters; typically these will be the baseline conditions and changes from baseline (but it may also be two competing scenarios).

Model users are allowed to characterize variables associated with each recovery unit (i.e., size of the population as determined from census counts or expert opinion, number of winter sites within a recovery unit) or use pre-programmed settings for White-nose Syndrome for default scenarios. Since there is concern that impacts upon the species may have both an immediate effect on the take of the species as well as a longer-term impact upon survival, the user can modify these two parameters. In the multi-hibernaculum tool, we used information on the spread process among Indiana bat hibernacula to project the timing and spatial extent of disease spread (see Thogmartin et al., In press).

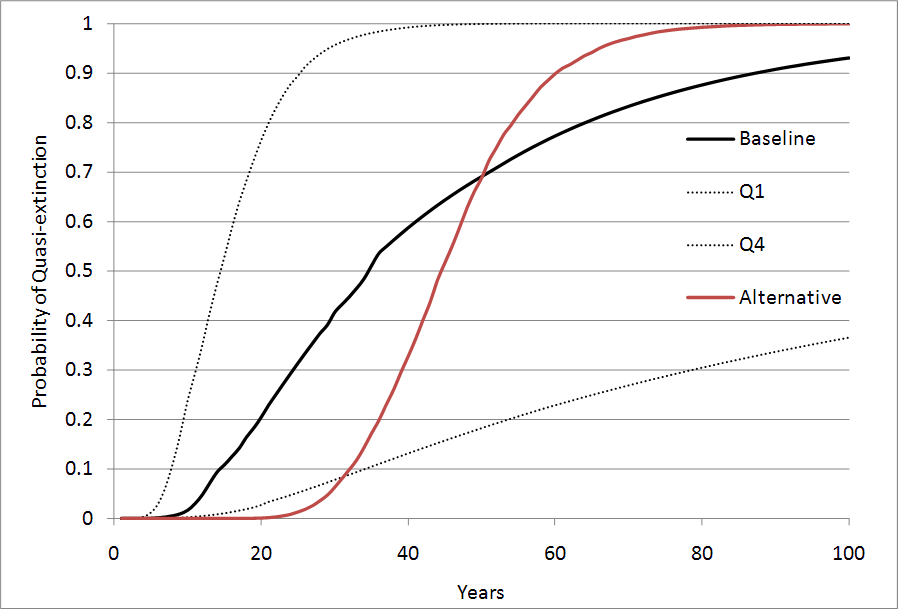
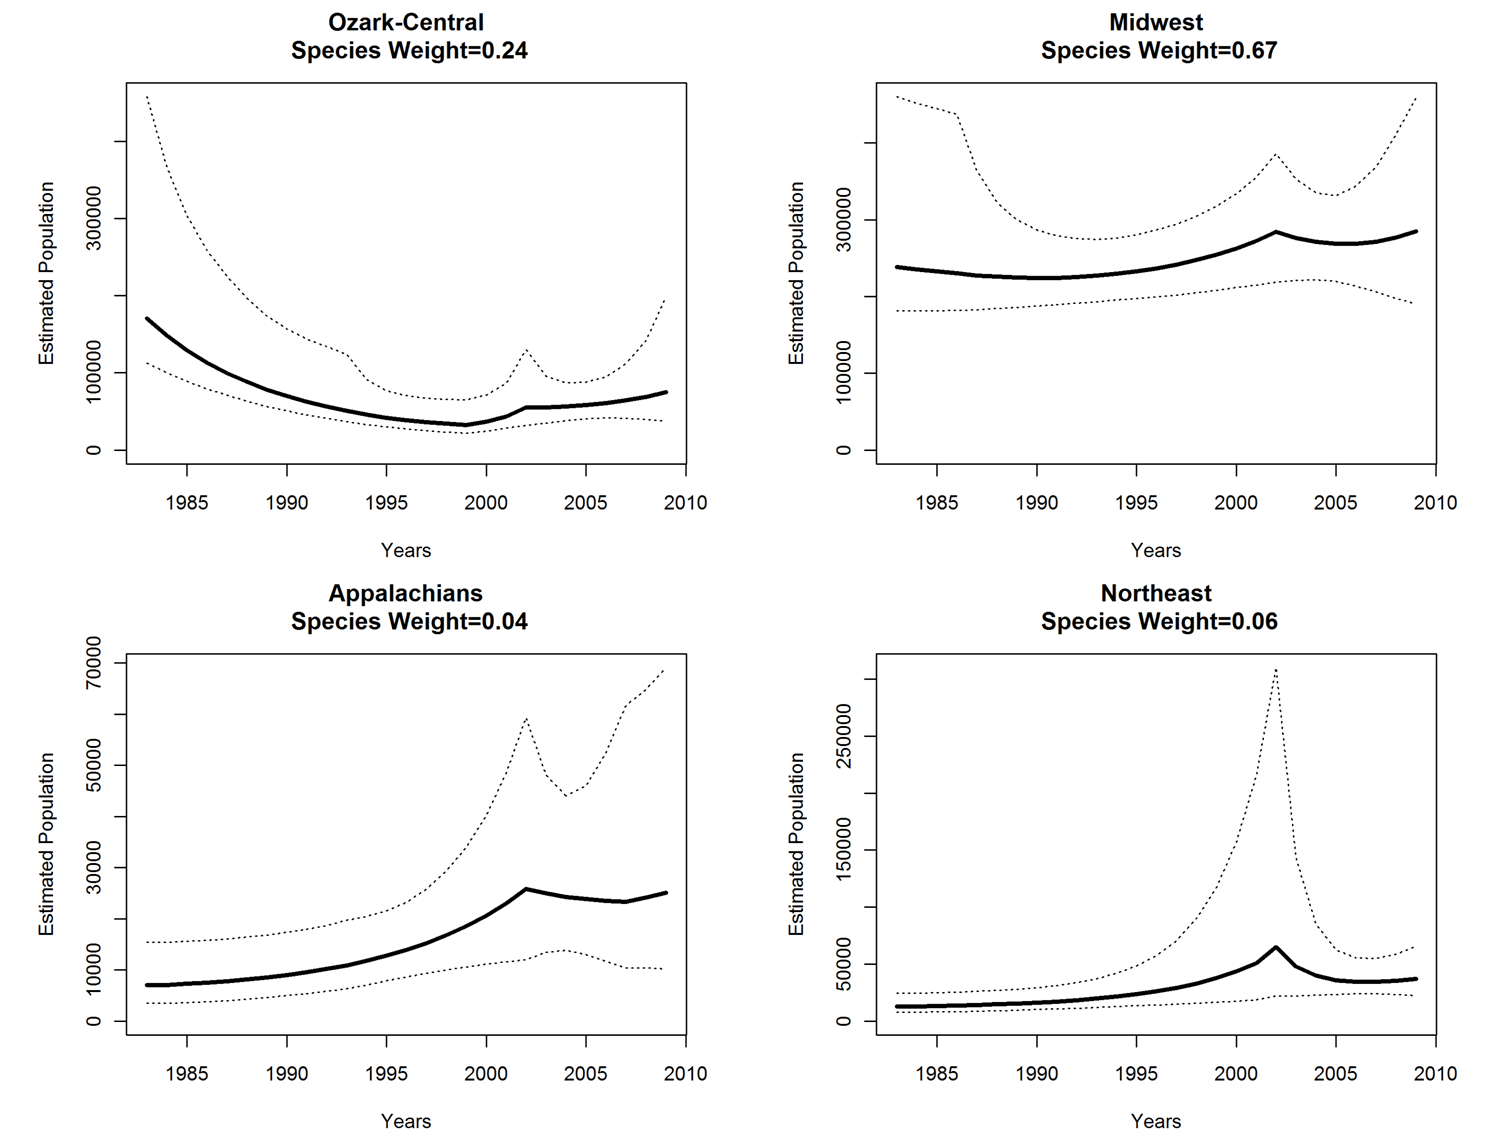
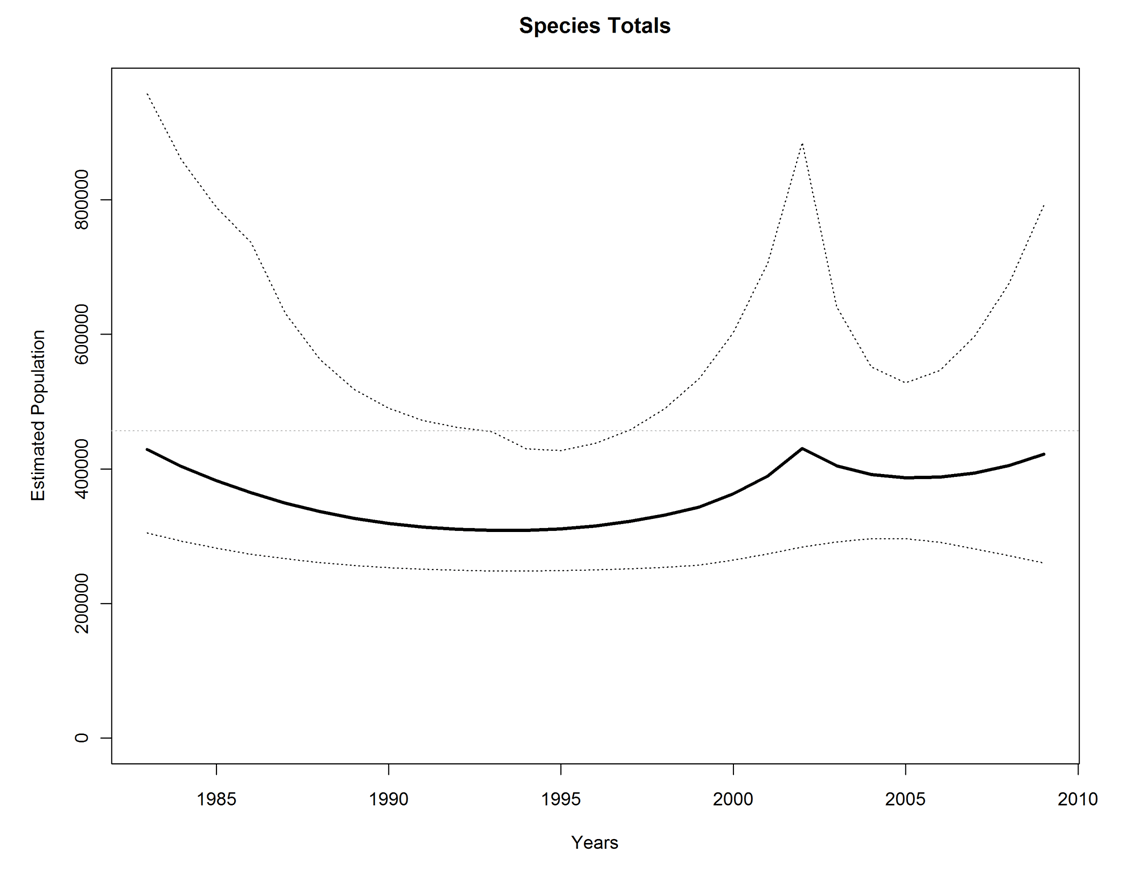
Lastly, a simple tabular and graphical output of model results is available. For instance, users can generate a graph of the differences in two model scenarios and their impact on time to extinction (Figure 2).

Figure 1. Distribution of demographic parameters for a stationary population of Indiana bats.

Figure 1. Distribution of demographic parameters for a stationary population of Indiana bats.

Figure 1. Distribution of demographic parameters for a stationary population of Indiana bats.

Figure 2. Hypothetical graphical output describing population dynamics for the baseline condition
Figure 2. Hypothetical graphical output describing population dynamics for the baseline condition (black bold line, with 95% confidence intervals as dashed lines) and in the face of an alternative scenario such as a management action. In this case, the uncertainty associated with the parameter estimates of the baseline condition overwhelms any ability to confidently discern an appreciable impact of the management action except as it may occur in the 15–30 years after the action; before and after that window of time an effect is not appreciably different from the baseline condition.

Parameter Estimates Derived From Trends in Hibernaculum Counts

We developed hierarchical log-linear change point models of wintering population counts to determine trend in Indiana bat abundance. We used this information to help determine the parameters of our matrix model of Indiana bat population dynamics.

Figure 3. Hypothetical graphical output for Indiana bat regional population scenarios
Figure 3. Mean (with 95% confidence interval) hibernacula and changes in trend estimates plotted by recovery unit. Note differing population sizes used in each graph. Recovery units are Ozark-Central (1), Midwest (2), Appalachians (3) and Northeast (4).


Figure 4. Indiana Bat Total Population Scenario
Figure 4. Predicted patterns in total annual population size of Indiana bats between 1983 and 2009 (with 90% confidence interval). The dashed horizontal line is the recovery criteria for this species, 457,000 bats.

Model details

For details, see:

Szymanski, J. A., L. Pruitt, M. C. Runge, M. Armstrong , R. A. King, C. McGowan, R. Niver, D. Sparks, and D. C. Brewer. 2010. Developing performance criteria for a population model for Indiana Bat conservation. A case study from the structured decision making workshop, December 8–12, 2008, National Conservation Training Center, Shepherdstown, West Virginia, USA.

Thogmartin, W. E., R. A. King, J. A Szymanski, and L. Pruitt. Space-time models for a panzootic in bats, with a focus on the endangered Indiana bat. Journal of Wildlife Diseases, In press.

Thogmartin, W. E., P. McKann, R. A. King, J. A. Szymanski, and L. Pruitt. 2012. Population-level impact of white-nose syndrome on the endangered Indiana bat. Journal of Mammalogy, In press.

Sensitivity of Small Populations of Indiana Bats to Risk of Extinction
We used our matrix model of Indiana bat population dynamics to assess the risk Indiana bats face when forced to small population sizes by White-nose Syndrome.  We examined the sensitivity of the species to varying levels of environmental stochasticity (Fig. A), to a persistent (ad nauseum) influence of White-nose Syndrome (Fig. B), and potential consequences of reduced group size while wintering (Fig. C) and breeding (Fig. D).

Figure A. Effects of increasing environmental stochasticity on estimated probability of quasi-extirpation for simulated Indiana bat populations. Environmental stochasticity values varied by ±0.04 (default), ±0.06, and ±0.12 of the randomly drawn parameter value for a) a starting population of 500 bats and a quasi-extirpation level of 250 bats, b) a starting population of 1,000 bats and a quasi-extirpation level of 250 bats, c) a starting population of 500 bats and a quasi-extirpation level of 500 bats, and d) a starting population of 1,000 bats and a quasi-extirpation level of 500 bats.

Figure A. Effects of increasing environmental stochasticity on estimated probability of quasi-extirpation for simulated Indiana bat populations. Environmental stochasticity values varied by ±0.04 (default), ±0.06, and ±0.12 of the randomly drawn parameter value for a) a starting population of 500 bats and a quasi-extirpation level of 250 bats, b) a starting population of 1,000 bats and a quasi-extirpation level of 250 bats, c) a starting population of 500 bats and a quasi-extirpation level of 500 bats, and d) a starting population of 1,000 bats and a quasi-extirpation level of 500 bats.


Figure B. Consequences of a persistent influence of white-nose syndrome on adult winter survival as measured by the probability of quasi-extirpation (threshold size = 250 bats). Risk was estimated for starting populations of 40,700 bats (default; 2008 population of Magazine Mine, Illinois, a Priority 1 hibernaculum), 5,000 bats, 1,000 bats, and 500 bats under scenarios with adult winter survival decreased by a) 0% (default values), b) 10%, c) 20% and d) 30% for all years >6 years after onset of white-nose syndrome. This consequence to survival post-White-nose Syndrome was irrespective of population abundance.

Figure B. Consequences of a persistent influence of white-nose syndrome on adult winter survival as measured by the probability of quasi-extirpation (threshold size = 250 bats). Risk was estimated for starting populations of 40,700 bats (default; 2008 population of Magazine Mine, Illinois, a Priority 1 hibernaculum), 5,000 bats, 1,000 bats, and 500 bats under scenarios with adult winter survival decreased by a) 0% (default values), b) 10%, c) 20% and d) 30% for all years >6 years after onset of white-nose syndrome. This consequence to survival post-White-nose Syndrome was irrespective of population abundance.


Figure C. Potential consequences to probability of quasi-extirpation (threshold = 250 female bats) of Allee effects influencing adult winter survival. Adult winter survival was decreased to a) 0.95, b) 0.85, c) 0.75, and d) 0.65 for different starting population sizes: 40,700 bats (default; 2008 population of Magazine Mine, Illinois, a Priority 1 hibernaculum), 5,000 bats, 1,000 bats, and 500 bats. Populations persisting above the quasi-extirpation level avoided consequences to adult winter survival.

Figure C. Potential consequences to probability of quasi-extirpation (threshold = 250 female bats) of Allee effects influencing adult winter survival. Adult winter survival was decreased to a) 0.95, b) 0.85, c) 0.75, and d) 0.65 for different starting population sizes: 40,700 bats (default; 2008 population of Magazine Mine, Illinois, a Priority 1 hibernaculum), 5,000 bats, 1,000 bats, and 500 bats. Populations persisting above the quasi-extirpation level avoided consequences to adult winter survival.


Figure D. Potential consequences to probability of quasi-extirpation (threshold = 250 female bats) of Allee effects influencing adult breeding success. Adult breeding success was decreased to a) 0.95, b) 0.85, c) 0.75, and d) 0.65 for different starting population sizes: 40,700 bats (default; 2008 population of Magazine Mine, Illinois, a Priority 1 hibernaculum), 5,000 bats, 1,000 bats, and 500 bats. Populations persisting above the quasi-extirpation level avoided consequences to adult winter survival. 

Figure D. Potential consequences to probability of quasi-extirpation (threshold = 250 female bats) of Allee effects influencing adult breeding success. Adult breeding success was decreased to a) 0.95, b) 0.85, c) 0.75, and d) 0.65 for different starting population sizes: 40,700 bats (default; 2008 population of Magazine Mine, Illinois, a Priority 1 hibernaculum), 5,000 bats, 1,000 bats, and 500 bats. Populations persisting above the quasi-extirpation level avoided consequences to adult winter survival. 

Poster: Small population consequences of white-nose syndrome: a sensitivity analysis

Accessibility FOIA Privacy Policies and Notices

Take Pride in America logo USA.gov logo U.S. Department of the Interior | U.S. Geological Survey

URL: http://www.umesc.usgs.gov/terrestrial/bats/indiana_bats.html
Page Contact Information: Contacting the Upper Midwest Environmental Sciences Center
Page Last Modified: May 24, 2012