Upper Midwest Environmental Sciences Center
Decision Support Systems
Percent Edge Tool
The Percent Edge Tool is an ArcMap tool. The Percent Edge Tool performs the following calculations for each polygon in a polygonal GIS layer: area, compactness, perimeter, edge lengths with adjacent polygons, and percentage of edge with adjacent polygons. This information can then be summarized into a pivot table and queried.
Example query: I want to know where are all of the large, compact, woody wetland polygons that share > 50% of their edge with emergent herbaceous wetlands.
FoxPercentEdge.dll
To install:
- You will need administrative privileges on your PC to register the DLL file (FoxPercentEdge.dll).
- Save the DLL file to your hard drive.
- Start ArcMap.
- Select then Tools menu.
- Select the Customize… menu item.
- Click the Add from file … button on bottom of the Customize dialog.
- Navigate to where you saved the DLL file, select the file, and click the Open button.
- Click the Commands tab of the Customize dialog.
- In the Categories listbox select Fox Tools item.
- Drag the PercentEdge command to an ArcMap toolbar.
- Click the Close button on the Customize dialog.
|
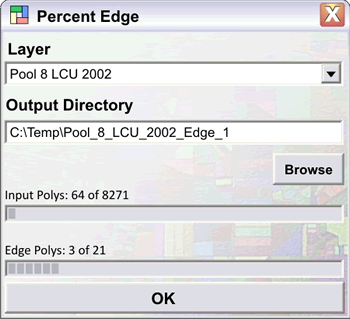 |
| Figure 1. The Percent Edge dialog. |
|
To use:
- Click the PercentEdge button to open the Percent Edge dialog (Figure 1).
- Choose an editable polygon theme.
- Click the Browse button and identify the output directory.
- Click OK button
- Program execution:
- The folder specified by the user in the Output Directory textbox is created.
- The folder’s name will have the following structure: User identified directory + Layer Name + “_Edge_“ + Iterative Number.
- Characters within the new folder’s name that are problematic to ArcMap will be replaced with underscore characters.
- Problematic characters include ~`!”@#$%^&*()+=[]{}:;,.’<>?/\ and blank spaces.
- The field EID is deleted if it already exists in the specified polygon theme.
- The field EID is added to the selected polygon theme. Each polygon is then number sequentially as they occur in the polygon theme. Polygons are indentified by this value in the output files.
- Polygons are iteratively processed. If a selection has been applied to the layer, then only the selected polygons will be analyzed.
- The program creates two DBF tables in the newly created folder the Features Table and the Edge Table (Figure 2).
- Features table
- Name: Features.dbf.
- Fields
- EID: has a one to one relationship with the EID created in the polygon layer.
- Area: the area of the iterative polygon. Units are the same as the those of the polygon layer.
- Perimeter: the perimeter of the iterative polygon. Units are the same as the those of the polygon layer.
- Compact: measure of shape diversity. Compactness calculates the circumference of a circle with the same area as the iterative polygon and divides that number by the perimeter of the iterative polygon. Polygons that are circular have a value of 1 and polygons that are infinitely linear have a value of 0.
- Feature attributes: all fields from the polygon layer are appended to features output file.
- Edge table
- Name: Edge.dbf.
- Fields
- EID1: the EID of the iterative polygon.
- EDI2: the EIDs of the polygons that share an edge with the iterative polygon.
- Edge: the length of edge shared between EID1 and EID2.
- P_Edge: the percent of EID’s perimeter shared with the EDI2 .
- What can I do with this information?
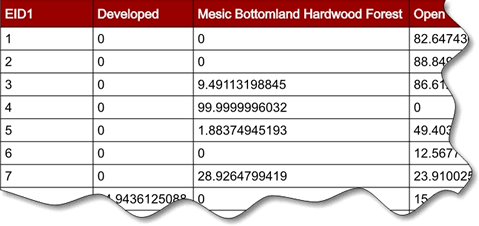
- Import the two DBF tables into a database and create a cross tab query that summarizes edge type for each polygon (Figure 3).
- Export the cross tab and join it back to the polygon layer.
- Now you can query for polygons based on the amount of edge they share, of a particular type, with their neighbors. Example: I want to find woody wetland polygons that are share > 50% of their edge with shallow marsh and are > 10,000 square meter in area and are highly compact (compactness > 0.7).
- Helpful links to information about working with Access databases.
- Information on importing dbase files into an Access database.
http://office.microsoft.com/en-us/access/HP051876101033.aspx
- How to create a crosstab query.
http://office.microsoft.com/en-us/access/HP051879651033.aspx?pid=CH063653161033
|
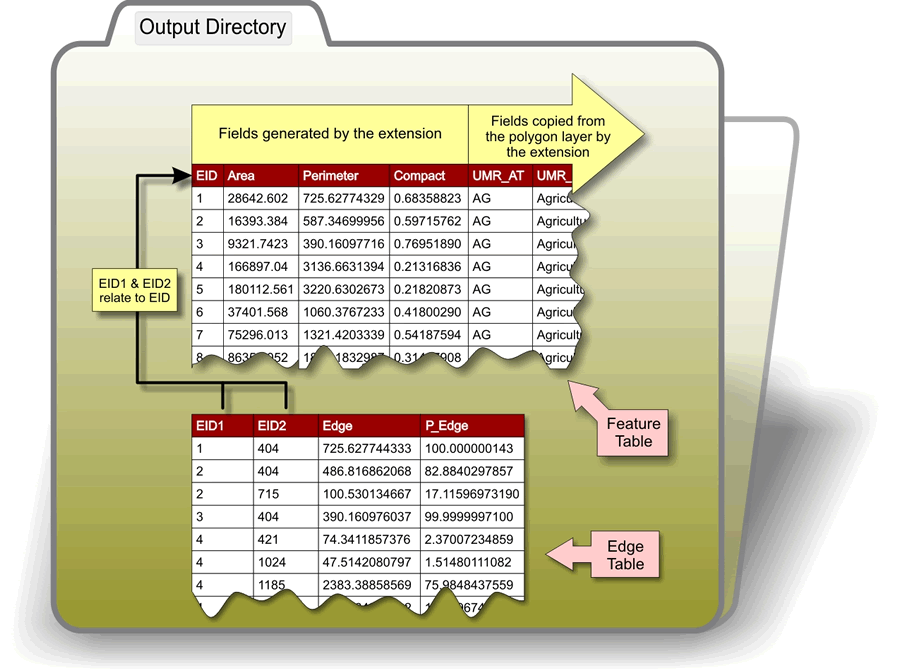 |
| Figure 2. The Features output file and the Edges output file. These documents can be added to a database and related to each other. Field EID relates to EID1 and EID2. |
|
| Figure 3. Example of a cross tab query of percent land cover edge type. The cross tab query was created in Access. |
Impact of UMESC Science
Patch connectivity and identifying patch edge types as habitat is a fundamental concept in landscape ecology. The Percent Edge Tool extends ArcMap and provides a functionally that allows scientists to investigate these aspects of a landscape.
Point of contact: Tim Fox
|
URL: http://umesc.usgs.gov/managment/dss/percent_edge_tool.html
Page Contact Information:
Contacting the Upper Midwest Environmental Sciences Center
Page Last Modified:
March 1, 2011