Upper Midwest Environmental Sciences Center
NESP DSS Reach Planning Information
NESP DSS Viewer: http://umesc-gisdb03.er.usgs.gov/nesp_dss/viewer.aspx
Contributions to this web page have not gone through the USGS review and approval process.
1. Geomorphology/ 1. Lg-scale Geomorphology – LSA/
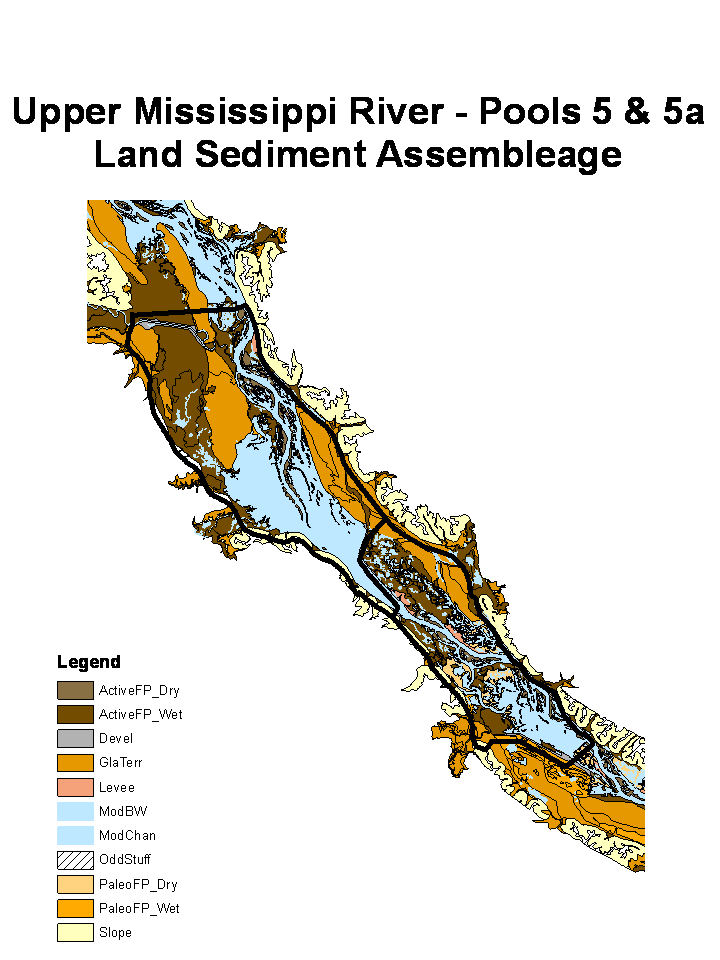 LgScale_Geomorph_Pool_5&5a.PNG– Land sediment assemblages are large scale geomorphic features classified in a hierarchical scheme to allow analysis at several scales. The methodology was developed for the U.S. Army Corps of Engineers Rock Island District archeologists who have requirements to protect pre-historic and historic cultural features. Archeological site identification can be greatly enhanced by knowing the relative age and forces forming the land surface in question. These features of the landscape are also considered to be strong ecological drivers because of their influence on soil moisture, soil type, and elevation. Four sets of data were completed semi-independently for four major river reaches and converted to a common classification scheme based on the relative moisture as determined by deposition and scour and frequency of inundation. Pools 5 and 5a Land Sediment Assemblages are illustrated here. Information on these data and unpublished reports can be obtained from Chuck Theiling, U.S. Army Corps of Engineers, Rock Island District, Rock Island, Illinois, charles.h.theiling@usace.army.mil
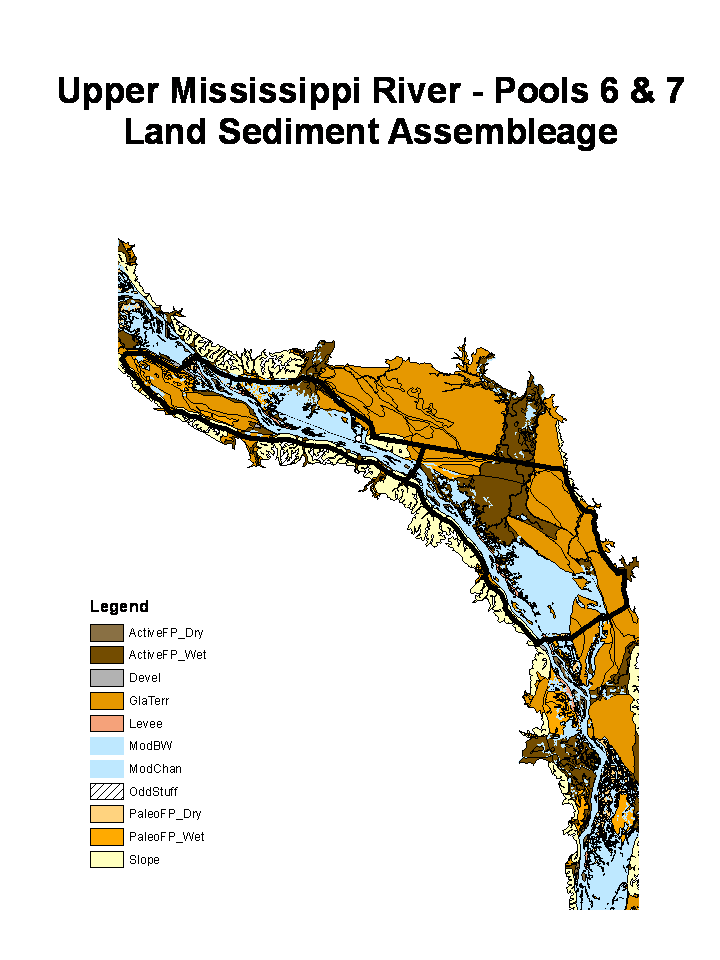 LgScale_Geomorph_Pool_6&7.PNG – Land sediment assemblages are large scale geomorphic features classified in a hierarchical scheme to allow analysis at several scales. The methodology was developed for the U.S. Army Corps of Engineers Rock Island District archeologists who have requirements to protect pre-historic and historic cultural features. Archeological site identification can be greatly enhanced by knowing the relative age and forces forming the land surface in question. These features of the landscape are also considered to be strong ecological drivers because of their influence on soil moisture, soil type, and elevation. Four sets of data were completed semi-independently for four major river reaches and converted to a common classification scheme based on the relative moisture as determined by deposition and scour and frequency of inundation. Pools 6 and 7 Land Sediment Assemblages are illustrated here. Information on these data and unpublished reports can be obtained from Chuck Theiling, U.S. Army Corps of Engineers, Rock Island District, Rock Island, Illinois, charles.h.theiling@usace.army.mil
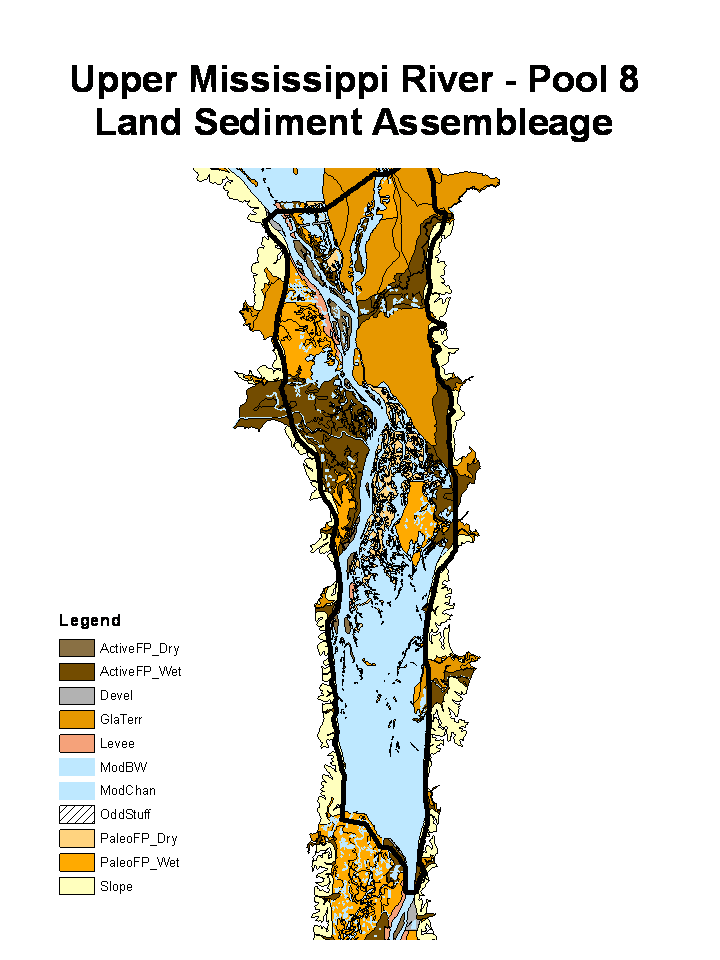 LgScale_Geomorph_Pool_8.PNG – Land sediment assemblages are large scale geomorphic features classified in a hierarchical scheme to allow analysis at several scales. The methodology was developed for the U.S. Army Corps of Engineers Rock Island District archeologists who have requirements to protect pre-historic and historic cultural features. Archeological site identification can be greatly enhanced by knowing the relative age and forces forming the land surface in question. These features of the landscape are also considered to be strong ecological drivers because of their influence on soil moisture, soil type, and elevation. Four sets of data were completed semi-independently for four major river reaches and converted to a common classification scheme based on the relative moisture as determined by deposition and scour and frequency of inundation. Pool 8 Land Sediment Assemblages are illustrated here. Information on these data and unpublished reports can be obtained from Chuck Theiling, U.S. Army Corps of Engineers, Rock Island District, Rock Island, Illinois, charles.h.theiling@usace.army.mil
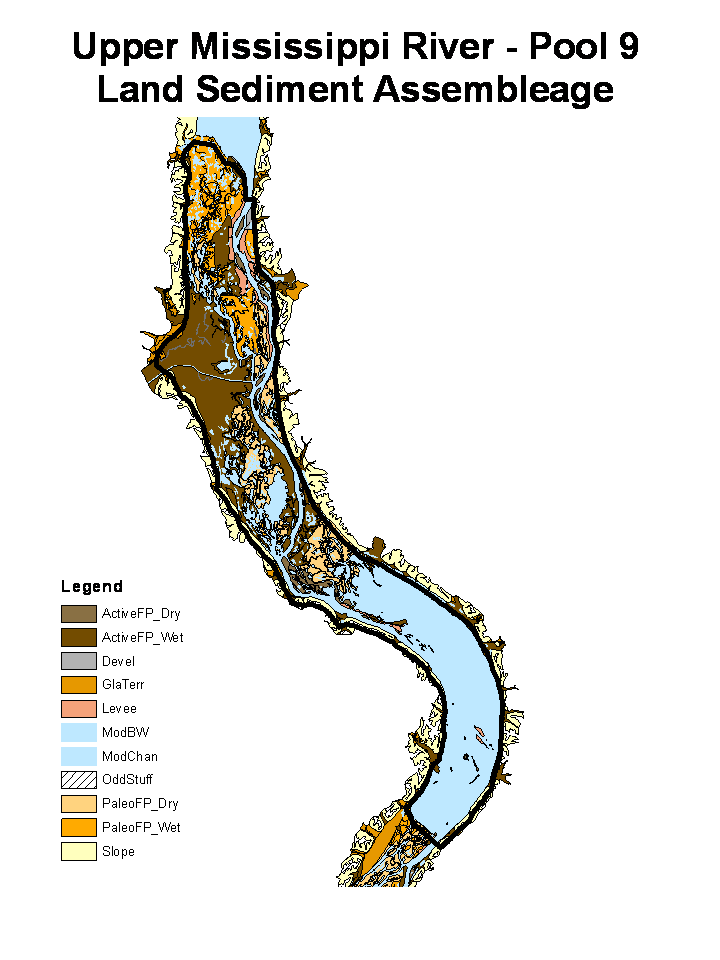 LgScale_Geomorph_Pool_9.PNG – Land sediment assemblages are large scale geomorphic features classified in a hierarchical scheme to allow analysis at several scales. The methodology was developed for the U.S. Army Corps of Engineers Rock Island District archeologists who have requirements to protect pre-historic and historic cultural features. Archeological site identification can be greatly enhanced by knowing the relative age and forces forming the land surface in question. These features of the landscape are also considered to be strong ecological drivers because of their influence on soil moisture, soil type, and elevation. Four sets of data were completed semi-independently for four major river reaches and converted to a common classification scheme based on the relative moisture as determined by deposition and scour and frequency of inundation. Pool 9 Land Sediment Assemblages are illustrated here. Information on these data and unpublished reports can be obtained from Chuck Theiling, U.S. Army Corps of Engineers, Rock Island District, Rock Island, Illinois, charles.h.theiling@usace.army.mil
1. Geomorphology/2. Cumulative Effects Historic Geomorphology/
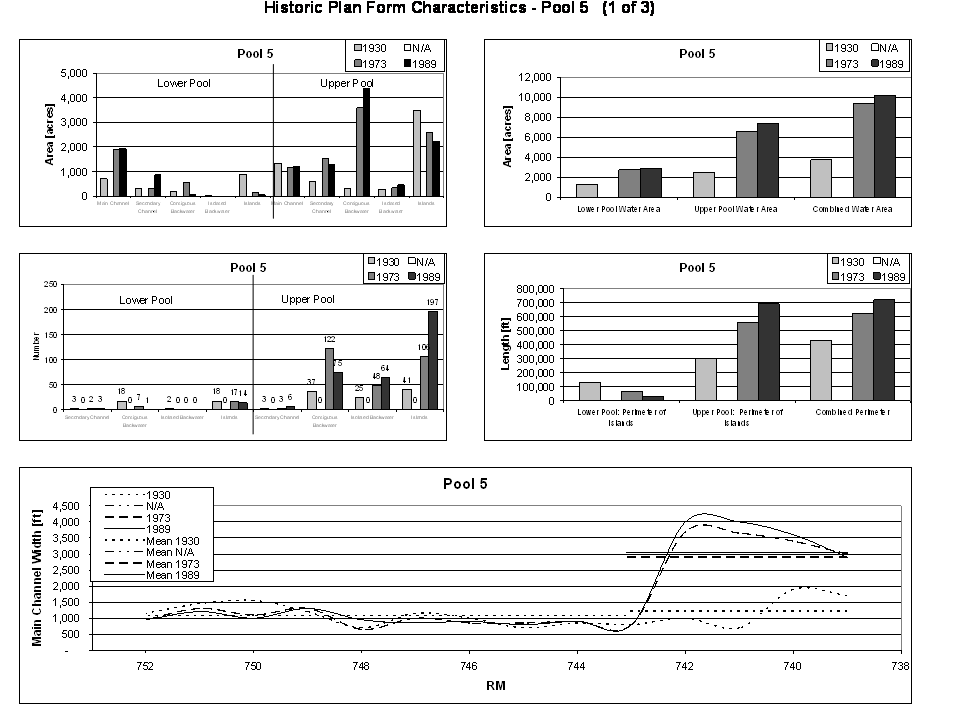
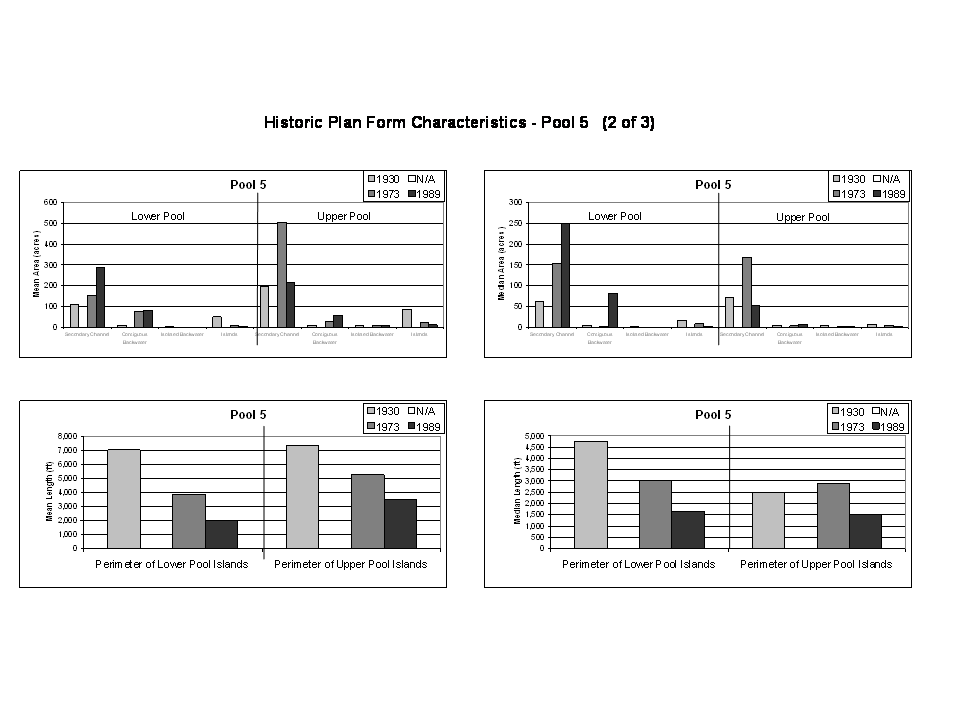
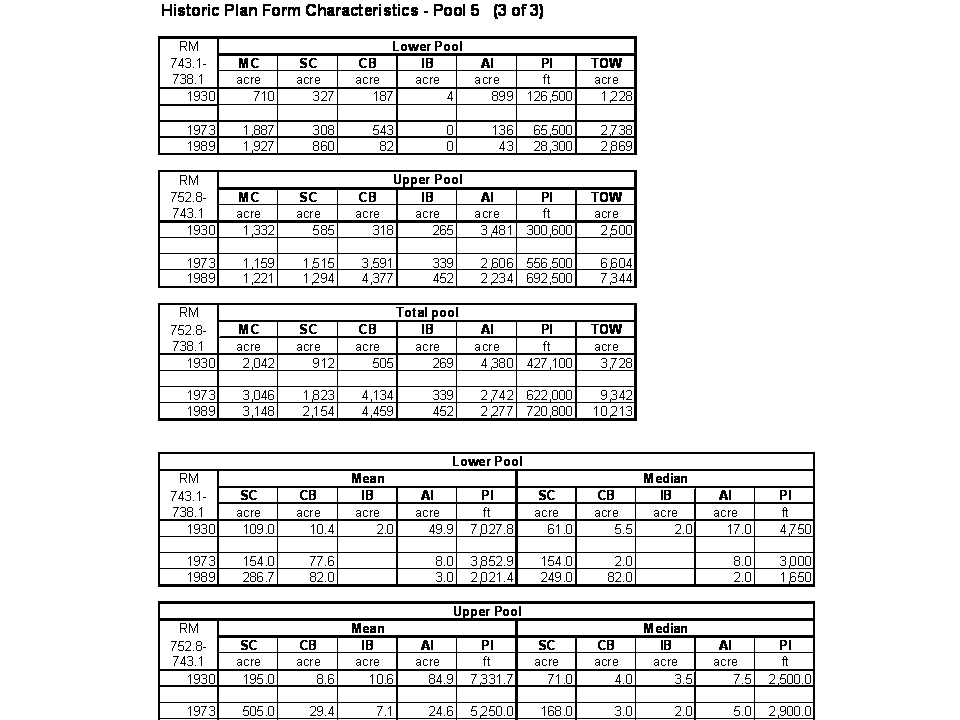
Pool 5/GeoAnalysis_Pool_5_X_of_3.PNG (3 files)– The Upper Mississippi River-Illinois Waterway System Navigation feasibility Study hired an expert panel to conduct a Cumulative Effects study of environmental conditions on the Upper Mississippi River System (http://www2.mvr.usace.army.mil/UMRS/NESP/Documents/Env%20Rpt%2040%20Vol%201.pdf). The panel completed and exhaustive review of geomorphology, hydrology, land cover, and development basin-wide. A comprehensive analysis of land forms provided surface area estimates (acres) of: Main Channel (MC), Secondary Channel (SC), contiguous Backwater (CB), Isolated Backwater (IB), Area of Islands (AI), Perimeter of Islands (PI), and Total Open Water (TOW) for pre-dam (1930), immediate post dam (1940 – 1943), and 1989. Plan form analysis statistics are presented in charts and table over several pages. This summary is the results for Pool 5.
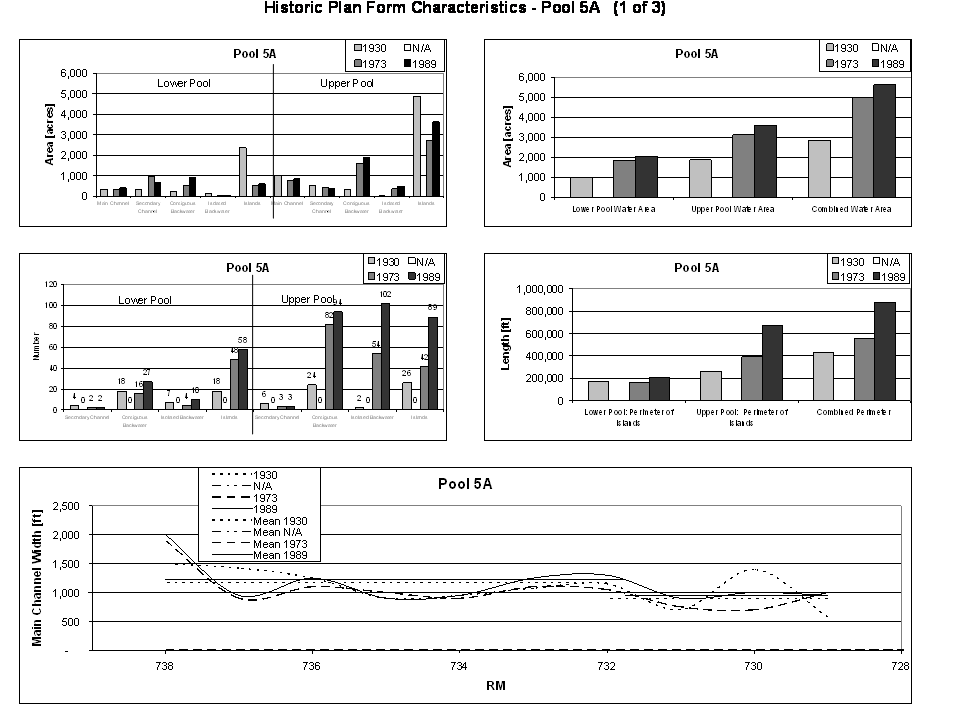
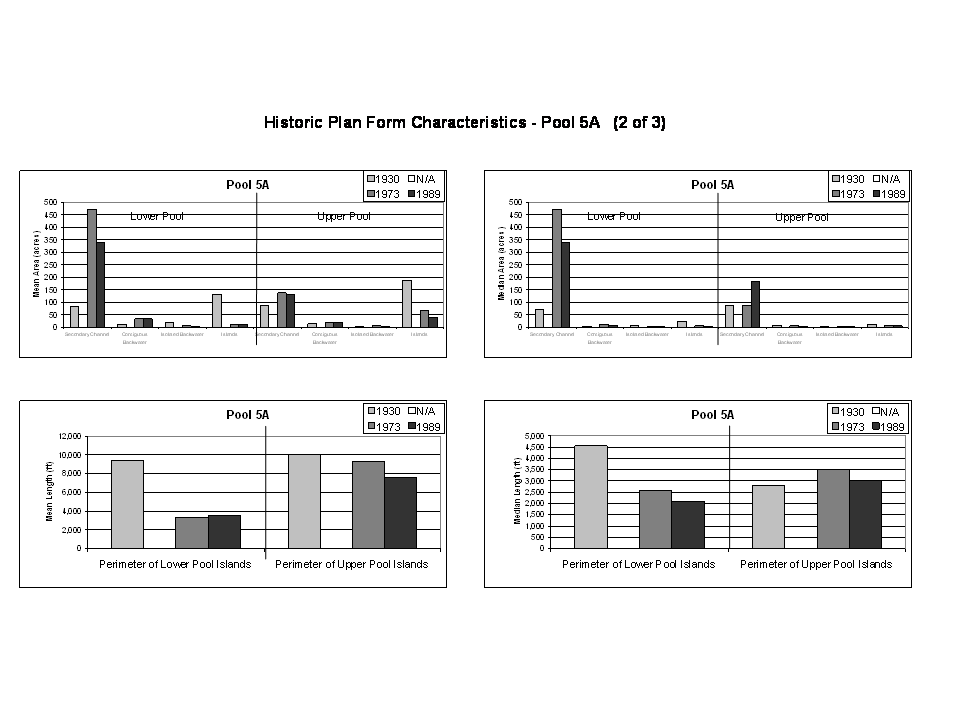
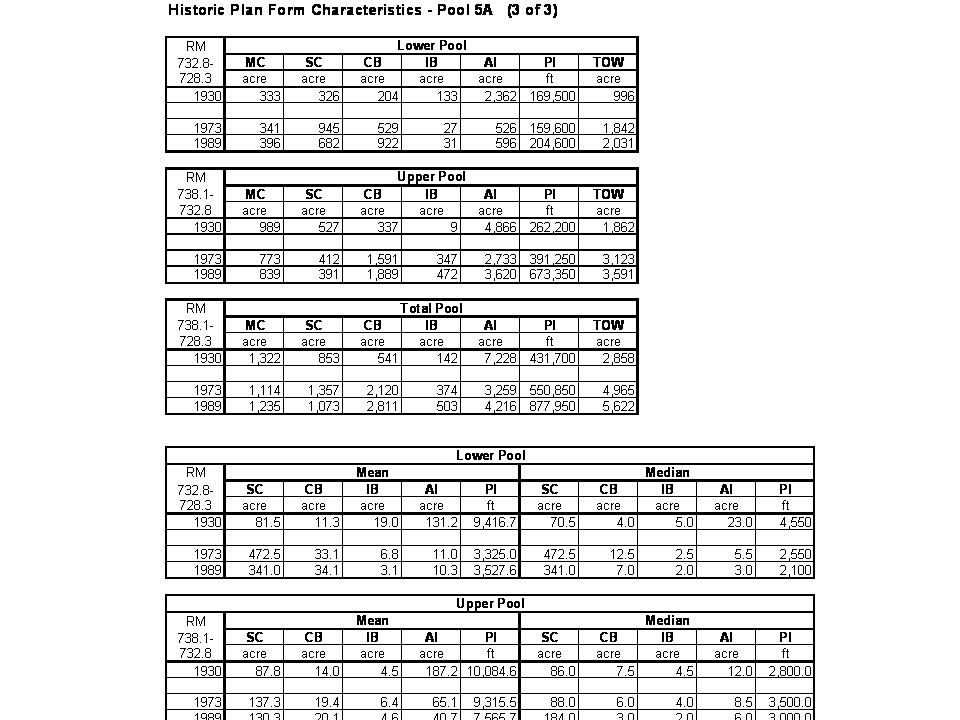
Pool 5a/GeoAnalysis_Pool_5a_X_of_3.PNG (3 files) – The Upper Mississippi River-Illinois Waterway System Navigation feasibility Study hired an expert panel to conduct a Cumulative Effects study of environmental conditions on the Upper Mississippi River System (http://www2.mvr.usace.army.mil/UMRS/NESP/Documents/Env%20Rpt%2040%20Vol%201.pdf). The panel completed and exhaustive review of geomorphology, hydrology, land cover, and development basin-wide. A comprehensive analysis of land forms provided surface area estimates (acres) of: Main Channel (MC), Secondary Channel (SC), contiguous Backwater (CB), Isolated Backwater (IB), Area of Islands (AI), Perimeter of Islands (PI), and Total Open Water (TOW) for pre-dam (1930), immediate post dam (1940 – 1943), and 1989. Plan form analysis statistics are presented in charts and table over several pages. This summary is the results for Pool 5a.
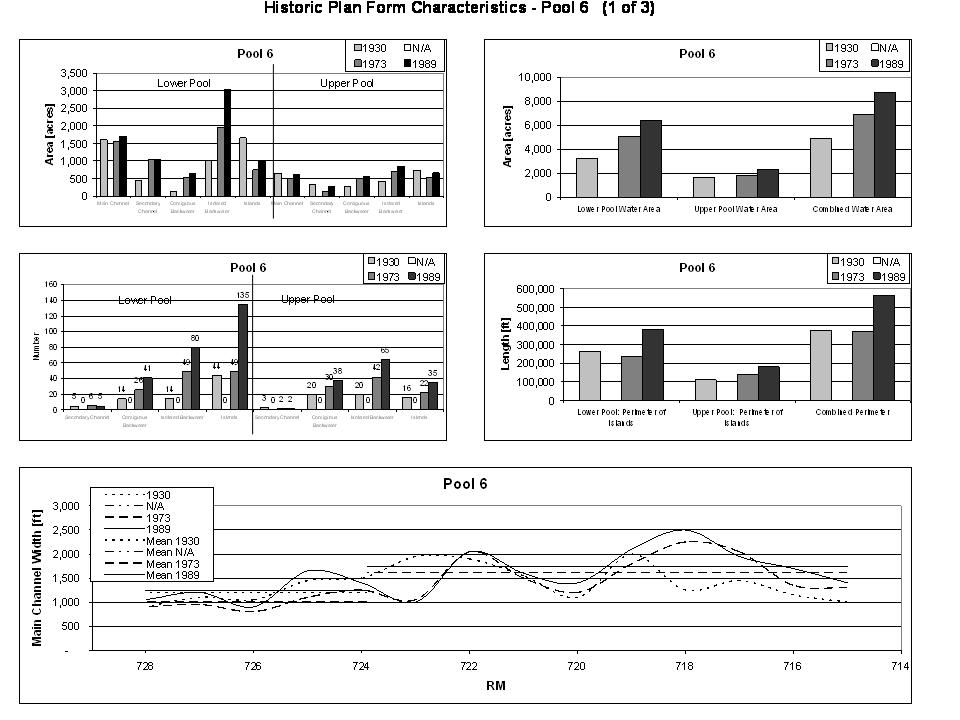
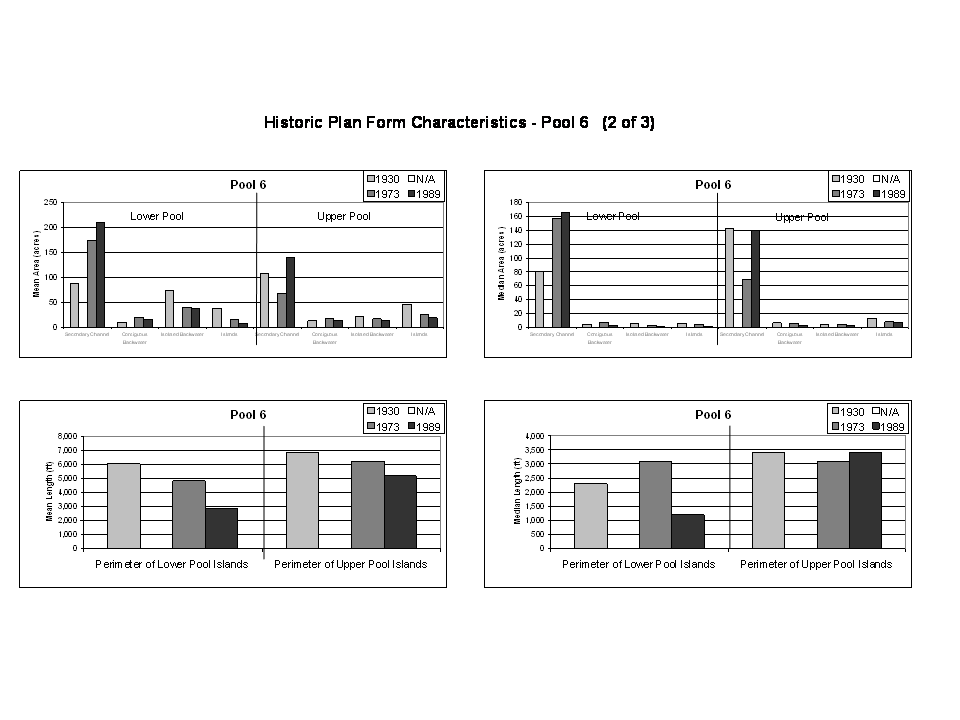
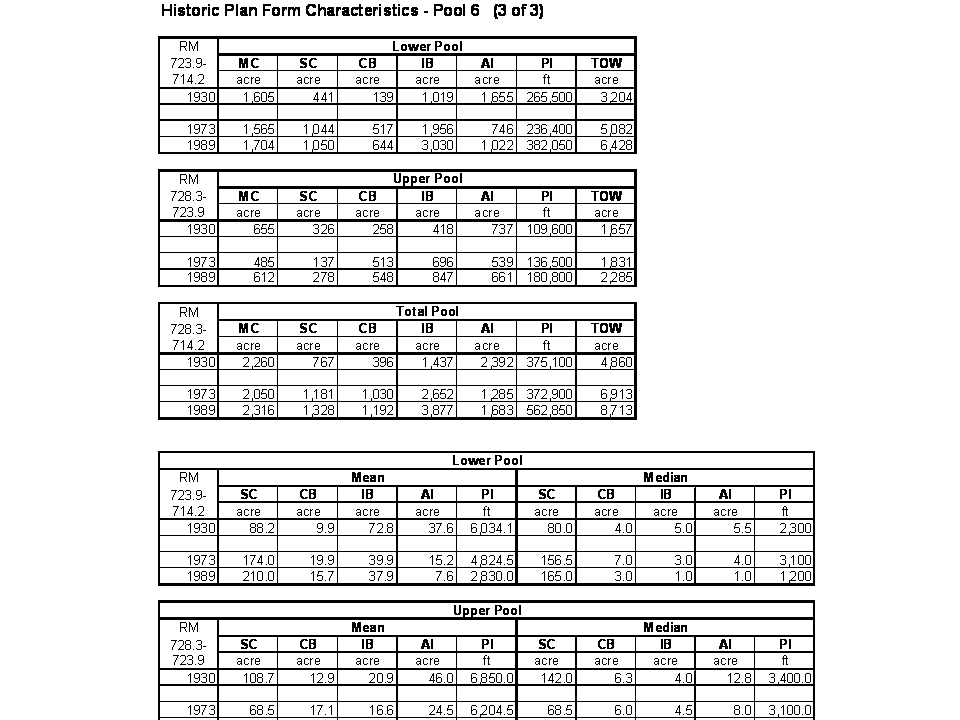
Pool 6/GeoAnalysis_Pool_6_X_of_3.PNG (3 files) – The Upper Mississippi River-Illinois Waterway System Navigation feasibility Study hired an expert panel to conduct a Cumulative Effects study of environmental conditions on the Upper Mississippi River System (http://www2.mvr.usace.army.mil/UMRS/NESP/Documents/Env%20Rpt%2040%20Vol%201.pdf). The panel completed and exhaustive review of geomorphology, hydrology, land cover, and development basin-wide. A comprehensive analysis of land forms provided surface area estimates (acres) of: Main Channel (MC), Secondary Channel (SC), contiguous Backwater (CB), Isolated Backwater (IB), Area of Islands (AI), Perimeter of Islands (PI), and Total Open Water (TOW) for pre-dam (1930), immediate post dam (1940 – 1943), and 1989. Plan form analysis statistics are presented in charts and table over several pages. This summary is the results for Pool 6.
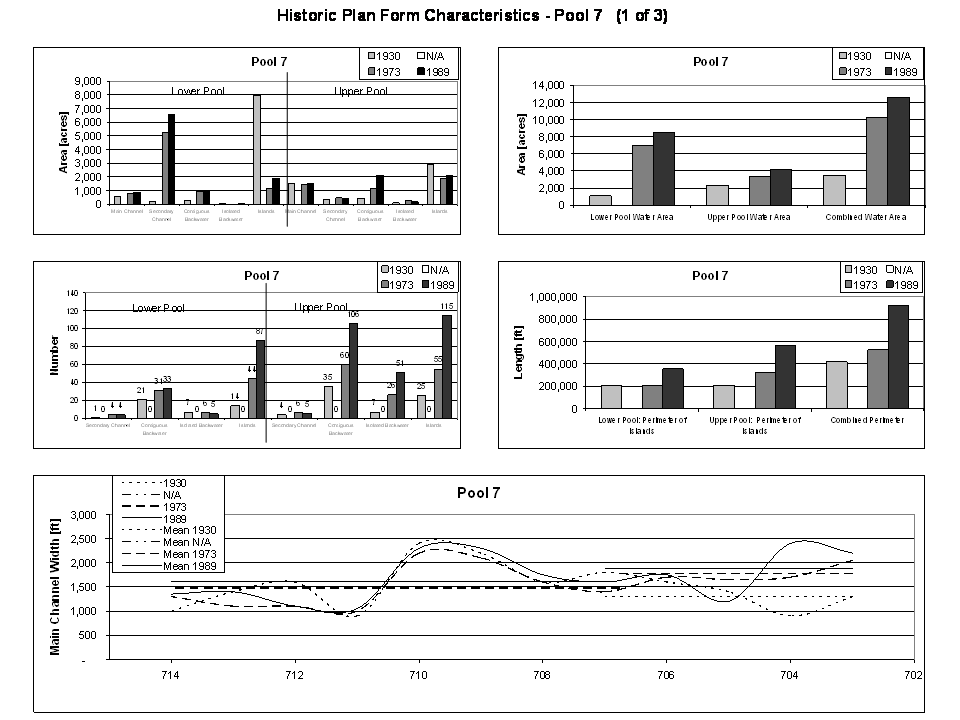
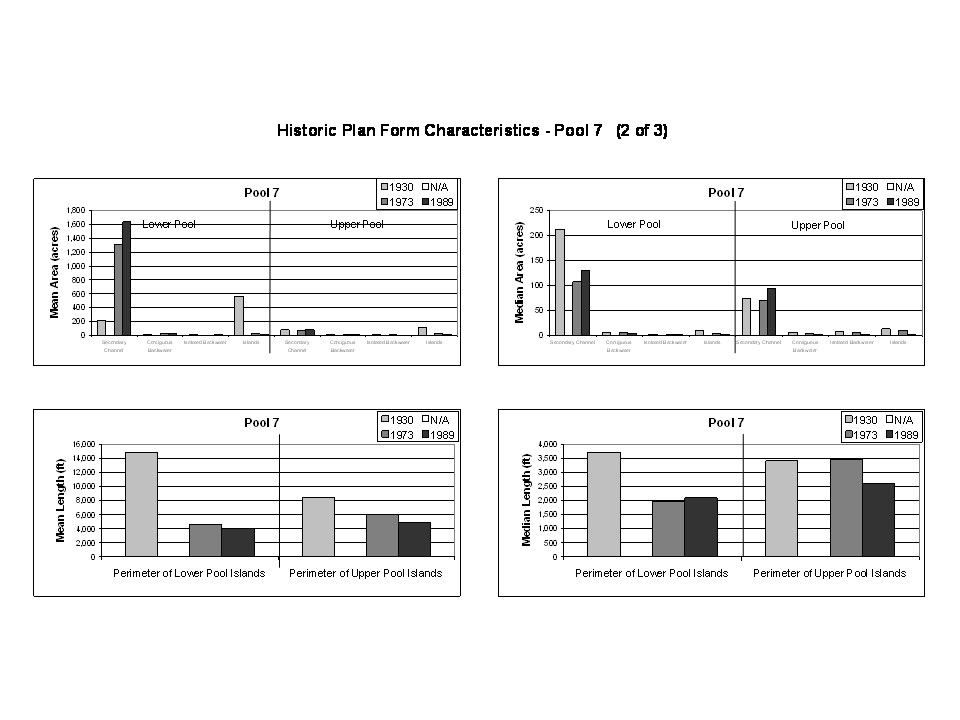
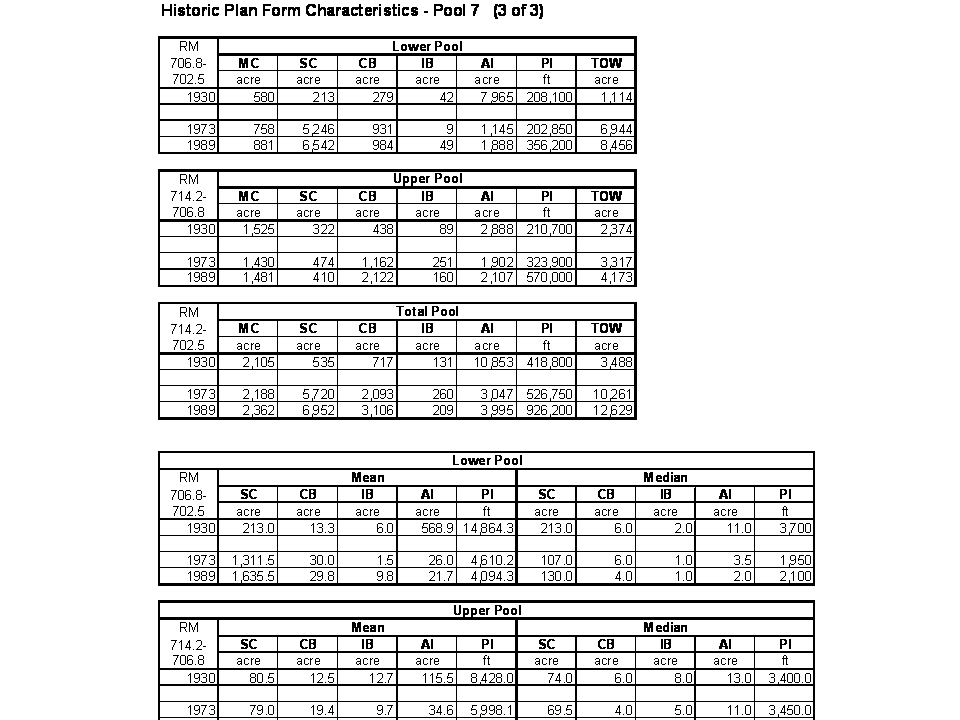
Pool 7/GeoAnalysis_Pool_7_X_of_3.PNG (3 files) – The Upper Mississippi River-Illinois Waterway System Navigation feasibility Study hired an expert panel to conduct a Cumulative Effects study of environmental conditions on the Upper Mississippi River System (http://www2.mvr.usace.army.mil/UMRS/NESP/Documents/Env%20Rpt%2040%20Vol%201.pdf). The panel completed and exhaustive review of geomorphology, hydrology, land cover, and development basin-wide. A comprehensive analysis of land forms provided surface area estimates (acres) of: Main Channel (MC), Secondary Channel (SC), contiguous Backwater (CB), Isolated Backwater (IB), Area of Islands (AI), Perimeter of Islands (PI), and Total Open Water (TOW) for pre-dam (1930), immediate post dam (1940 – 1943), and 1989. Plan form analysis statistics are presented in charts and table over several pages. This summary is the results for Pool 7.
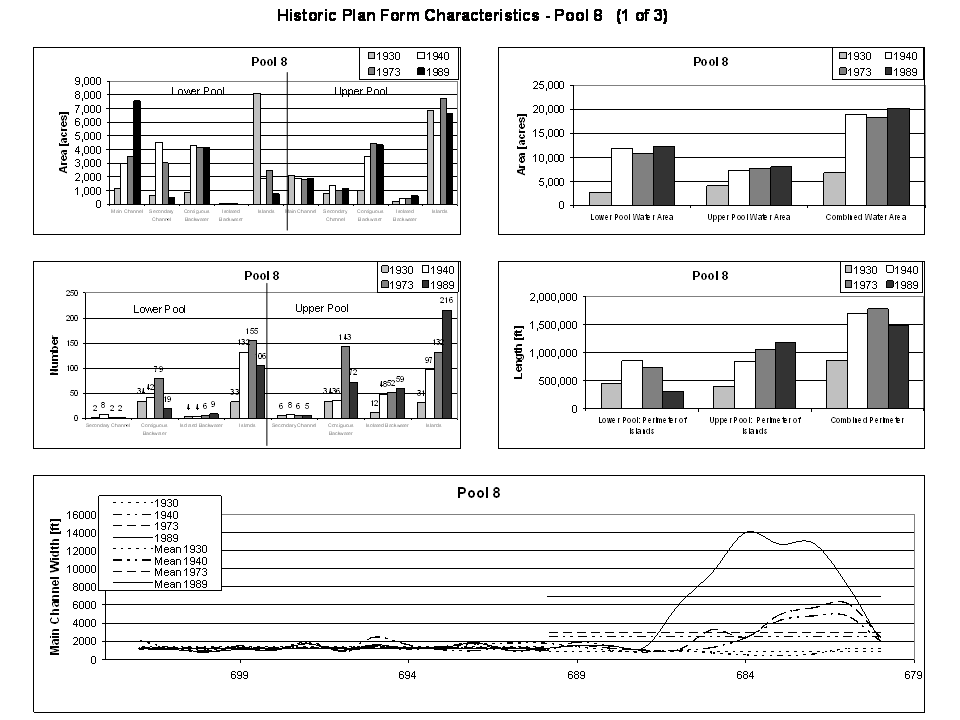
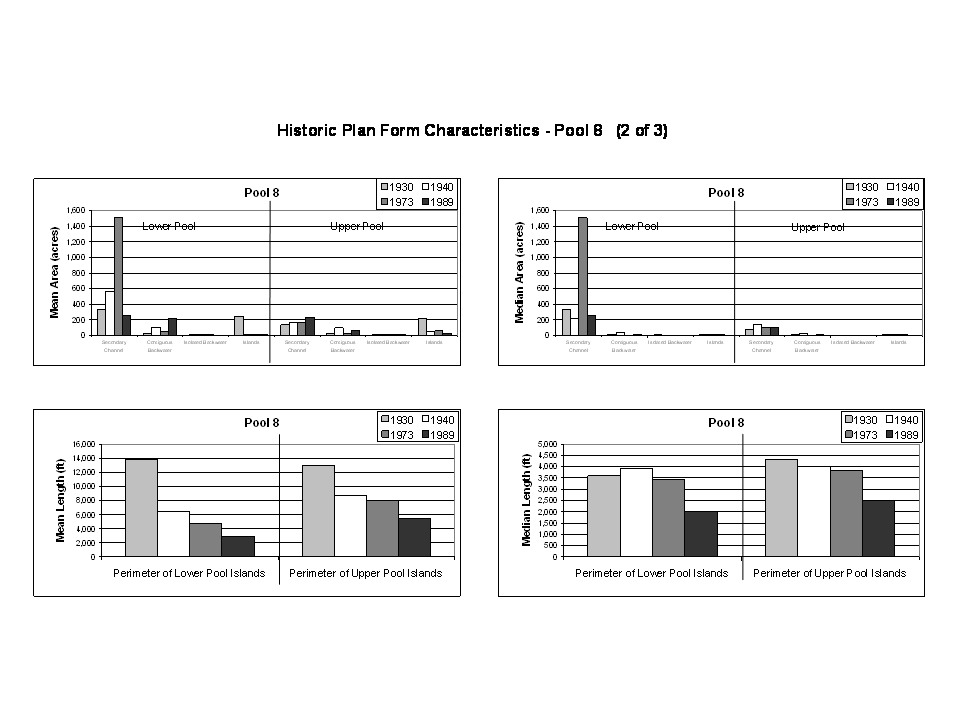
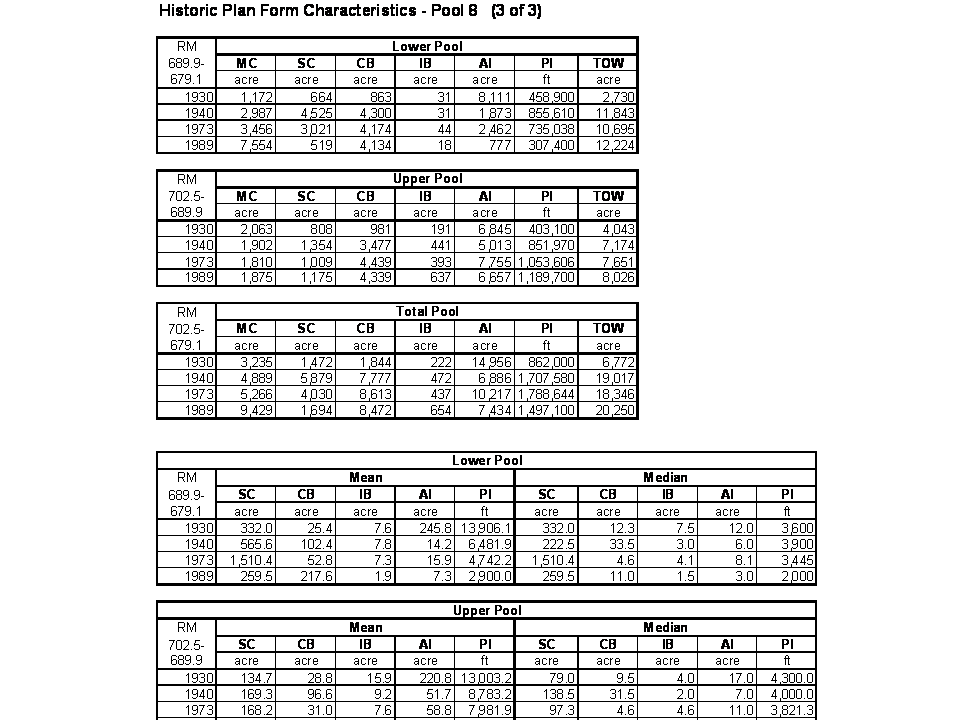
Pool 8/GeoAnalysis_Pool_8_X_of_3.PNG (3 files) – The Upper Mississippi River-Illinois Waterway System Navigation feasibility Study hired an expert panel to conduct a Cumulative Effects study of environmental conditions on the Upper Mississippi River System (http://www2.mvr.usace.army.mil/UMRS/NESP/Documents/Env%20Rpt%2040%20Vol%201.pdf). The panel completed and exhaustive review of geomorphology, hydrology, land cover, and development basin-wide. A comprehensive analysis of land forms provided surface area estimates (acres) of: Main Channel (MC), Secondary Channel (SC), contiguous Backwater (CB), Isolated Backwater (IB), Area of Islands (AI), Perimeter of Islands (PI), and Total Open Water (TOW) for pre-dam (1930), immediate post dam (1940 – 1943), and 1989. Plan form analysis statistics are presented in charts and table over several pages. This summary is the results for Pool 8.


Pool 9/GeoAnalysis_Pool_9_X_of_3.PNG (3 files) – The Upper Mississippi River-Illinois Waterway System Navigation feasibility Study hired an expert panel to conduct a Cumulative Effects study of environmental conditions on the Upper Mississippi River System (http://www2.mvr.usace.army.mil/UMRS/NESP/Documents/Env%20Rpt%2040%20Vol%201.pdf). The panel completed and exhaustive review of geomorphology, hydrology, land cover, and development basin-wide. A comprehensive analysis of land forms provided surface area estimates (acres) of: Main Channel (MC), Secondary Channel (SC), contiguous Backwater (CB), Isolated Backwater (IB), Area of Islands (AI), Perimeter of Islands (PI), and Total Open Water (TOW) for pre-dam (1930), immediate post dam (1940 – 1943), and 1989. Plan form analysis statistics are presented in charts and table over several pages. This summary is the results for Pool 9.
1. Geomorphology/3. Cumulative Effects Predicted Geomorphology/
WEST aquatic area prediction P_05.xls – The Upper Mississippi River-Illinois Waterway System Navigation feasibility Study hired an expert panel to conduct a Cumulative Effects study of environmental conditions on the Upper Mississippi River System (http://www2.mvr.usace.army.mil/UMRS/NESP/Documents/Env%20Rpt%2040%20Vol%201.pdf ). The panel completed and exhaustive review of geomorphology, hydrology, land cover, and development basin-wide. A comprehensive analysis of land forms provided surface area estimates (acres) of: Main Channel (MC), Secondary Channel (SC), contiguous Backwater (CB), Isolated Backwater (IB), Area of Islands (AI), Perimeter of Islands (PI), and Total Open Water (TOW) for pre-dam (1930), immediate post dam (1940 – 1943), and 1989. The panel considered the processes and rates of change and then estimated future changes expected to occur by 2050. This summary is the results for Pool 5.
WEST aquatic area prediction P_05A.xls – The Upper Mississippi River-Illinois Waterway System Navigation feasibility Study hired an expert panel to conduct a Cumulative Effects study of environmental conditions on the Upper Mississippi River System (http://www2.mvr.usace.army.mil/UMRS/NESP/Documents/Env%20Rpt%2040%20Vol%201.pdf). The panel completed and exhaustive review of geomorphology, hydrology, land cover, and development basin-wide. A comprehensive analysis of land forms provided surface area estimates (acres) of: Main Channel (MC), Secondary Channel (SC), contiguous Backwater (CB), Isolated Backwater (IB), Area of Islands (AI), Perimeter of Islands (PI), and Total Open Water (TOW) for pre-dam (1930), immediate post dam (1940 – 1943), and 1989. The panel considered the processes and rates of change and then estimated future changes expected to occur by 2050. This summary is the results for Pool 5a.
WEST aquatic area prediction P_06.xls – The Upper Mississippi River-Illinois Waterway System Navigation feasibility Study hired an expert panel to conduct a Cumulative Effects study of environmental conditions on the Upper Mississippi River System (http://www2.mvr.usace.army.mil/UMRS/NESP/Documents/Env%20Rpt%2040%20Vol%201.pdf). The panel completed and exhaustive review of geomorphology, hydrology, land cover, and development basin-wide. A comprehensive analysis of land forms provided surface area estimates (acres) of: Main Channel (MC), Secondary Channel (SC), contiguous Backwater (CB), Isolated Backwater (IB), Area of Islands (AI), Perimeter of Islands (PI), and Total Open Water (TOW) for pre-dam (1930), immediate post dam (1940 – 1943), and 1989. The panel considered the processes and rates of change and then estimated future changes expected to occur by 2050. This summary is the results for Pool 6.
WEST aquatic area prediction P_07.xls – The Upper Mississippi River-Illinois Waterway System Navigation feasibility Study hired an expert panel to conduct a Cumulative Effects study of environmental conditions on the Upper Mississippi River System (http://www2.mvr.usace.army.mil/UMRS/NESP/Documents/Env%20Rpt%2040%20Vol%201.pdf). The panel completed and exhaustive review of geomorphology, hydrology, land cover, and development basin-wide. A comprehensive analysis of land forms provided surface area estimates (acres) of: Main Channel (MC), Secondary Channel (SC), contiguous Backwater (CB), Isolated Backwater (IB), Area of Islands (AI), Perimeter of Islands (PI), and Total Open Water (TOW) for pre-dam (1930), immediate post dam (1940 – 1943), and 1989. The panel considered the processes and rates of change and then estimated future changes expected to occur by 2050. This summary is the results for Pool 7.
WEST aquatic area prediction P_08.xls – The Upper Mississippi River-Illinois Waterway System Navigation feasibility Study hired an expert panel to conduct a Cumulative Effects study of environmental conditions on the Upper Mississippi River System (http://www2.mvr.usace.army.mil/UMRS/NESP/Documents/Env%20Rpt%2040%20Vol%201.pdf). The panel completed and exhaustive review of geomorphology, hydrology, land cover, and development basin-wide. A comprehensive analysis of land forms provided surface area estimates (acres) of: Main Channel (MC), Secondary Channel (SC), contiguous Backwater (CB), Isolated Backwater (IB), Area of Islands (AI), Perimeter of Islands (PI), and Total Open Water (TOW) for pre-dam (1930), immediate post dam (1940 – 1943), and 1989. The panel considered the processes and rates of change and then estimated future changes expected to occur by 2050. This summary is the results for Pool 8.
WEST aquatic area prediction P_09.xls – The Upper Mississippi River-Illinois Waterway System Navigation feasibility Study hired an expert panel to conduct a Cumulative Effects study of environmental conditions on the Upper Mississippi River System (http://www2.mvr.usace.army.mil/UMRS/NESP/Documents/Env%20Rpt%2040%20Vol%201.pdf). The panel completed and exhaustive review of geomorphology, hydrology, land cover, and development basin-wide. A comprehensive analysis of land forms provided surface area estimates (acres) of: Main Channel (MC), Secondary Channel (SC), contiguous Backwater (CB), Isolated Backwater (IB), Area of Islands (AI), Perimeter of Islands (PI), and Total Open Water (TOW) for pre-dam (1930), immediate post dam (1940 – 1943), and 1989. The panel considered the processes and rates of change and then estimated future changes expected to occur by 2050. This summary is the results for Pool 9.
1. Geomorphology/4. HNA Predicted Geomorphology/
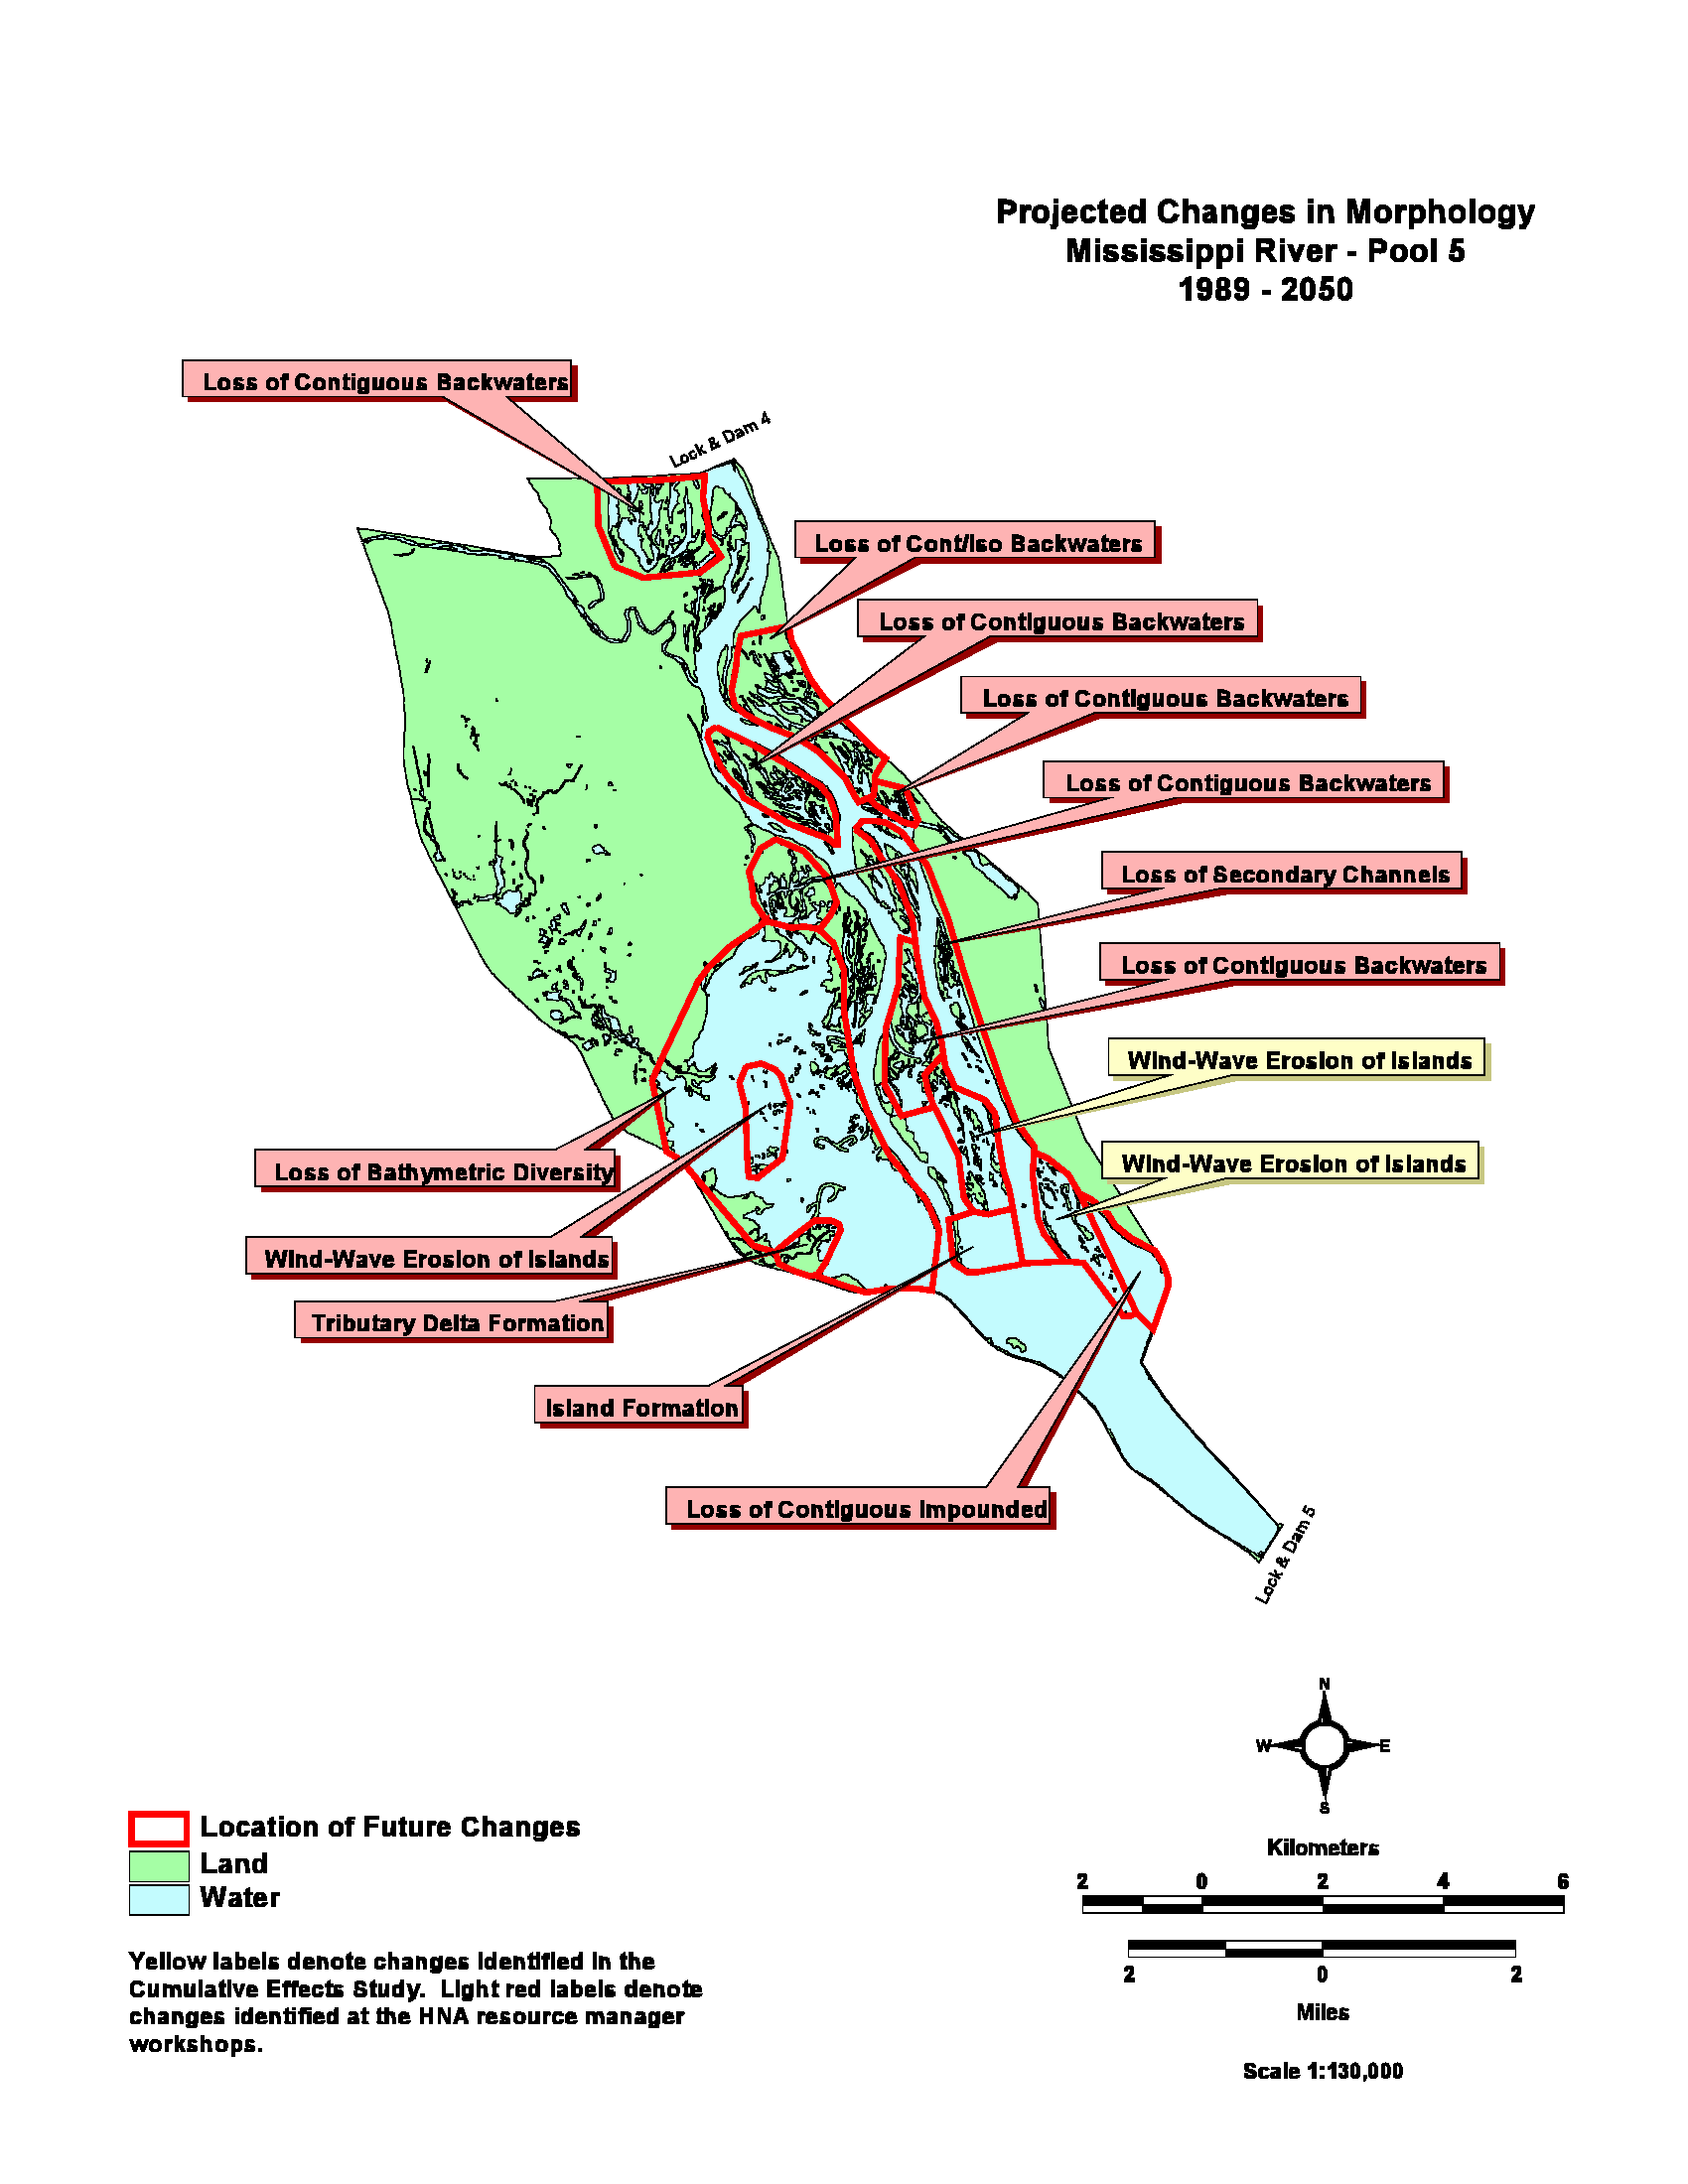 HNA_Predicted_Geomorphology_Pool_5.png – The Upper Mississippi River Habitat Needs Assessment surveyed river managers to provide site-specific details to augment prior remote sensing assessments of future geomorphic change. The product of four workshops distributed throughout the UMRS was an attributed, pool-scale map set identifying locations of anticipated change and the geomorphic process responsible for identified changes. These and other results of the Habitat Needs Assessment can be obtained at: http://www.umesc.usgs.gov/habitat_needs_assessment/emp_hna.html
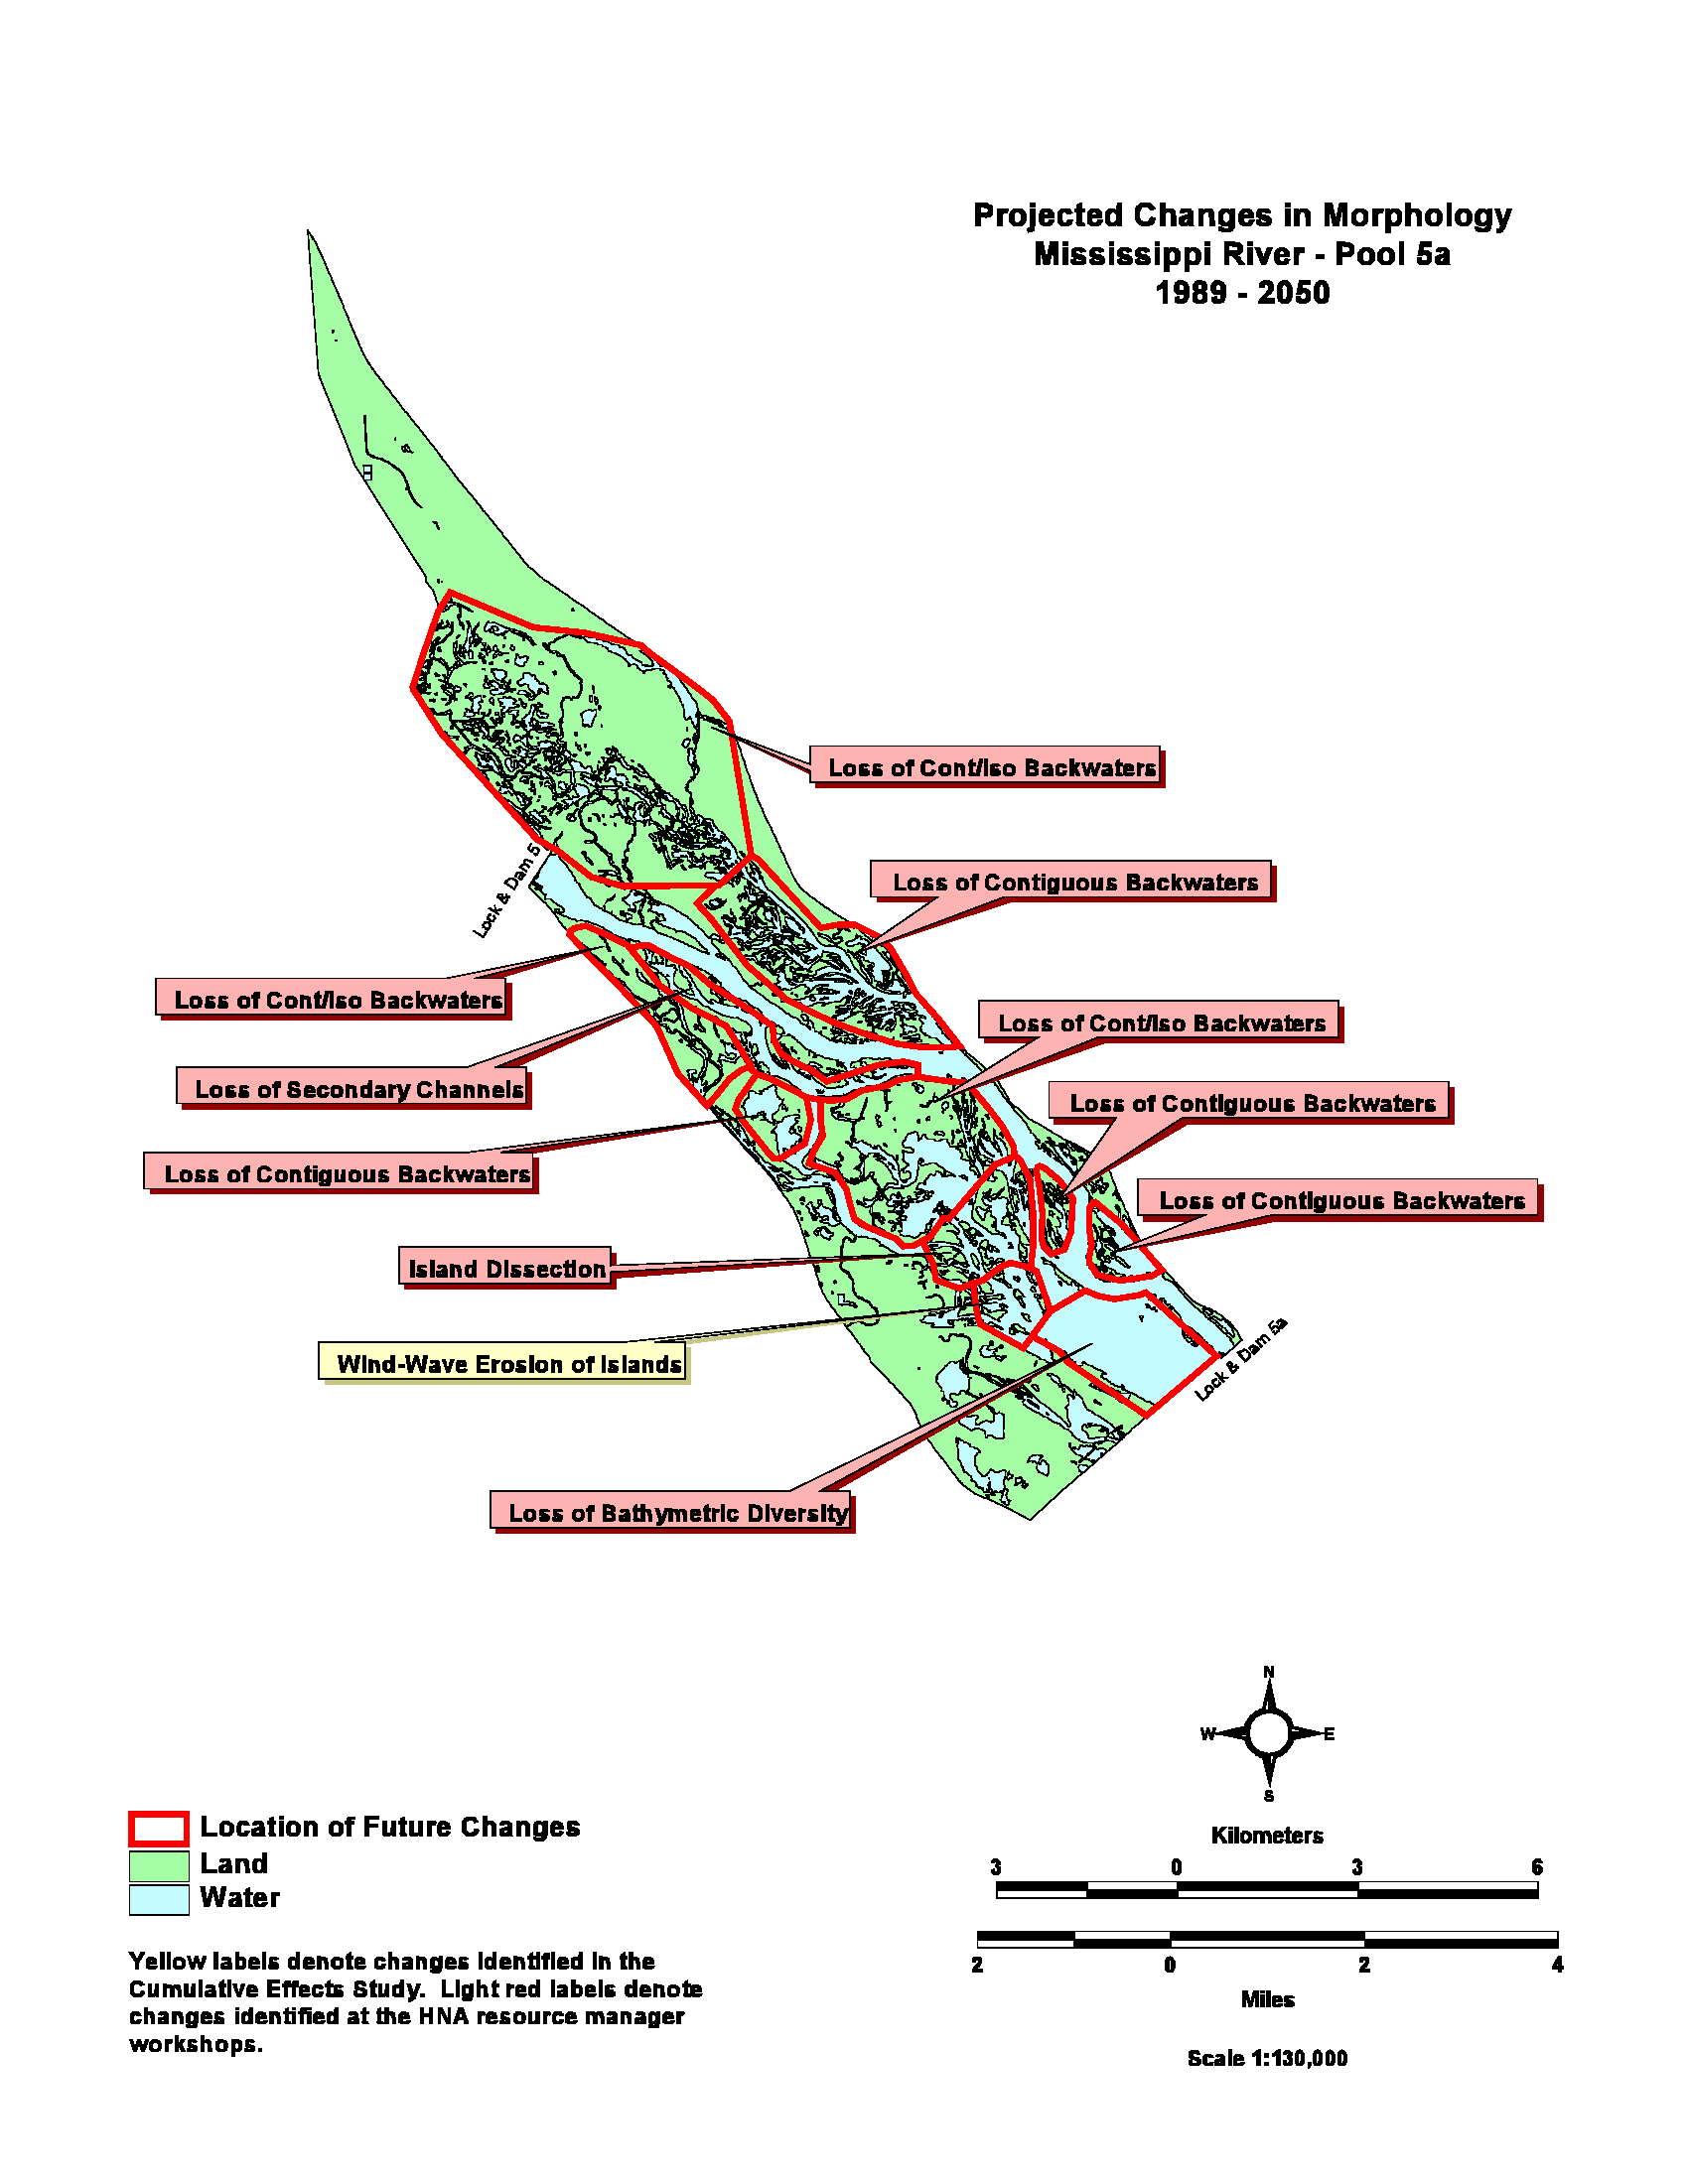 HNA_Predicted_Geomorphology_Pool_5a.png – The Upper Mississippi River Habitat Needs Assessment surveyed river managers to provide site-specific details to augment prior remote sensing assessments of future geomorphic change. The product of four workshops distributed throughout the UMRS was an attributed, pool-scale map set identifying locations of anticipated change and the geomorphic process responsible for identified changes. These and other results of the Habitat Needs Assessment can be obtained at: http://www.umesc.usgs.gov/habitat_needs_assessment/emp_hna.html
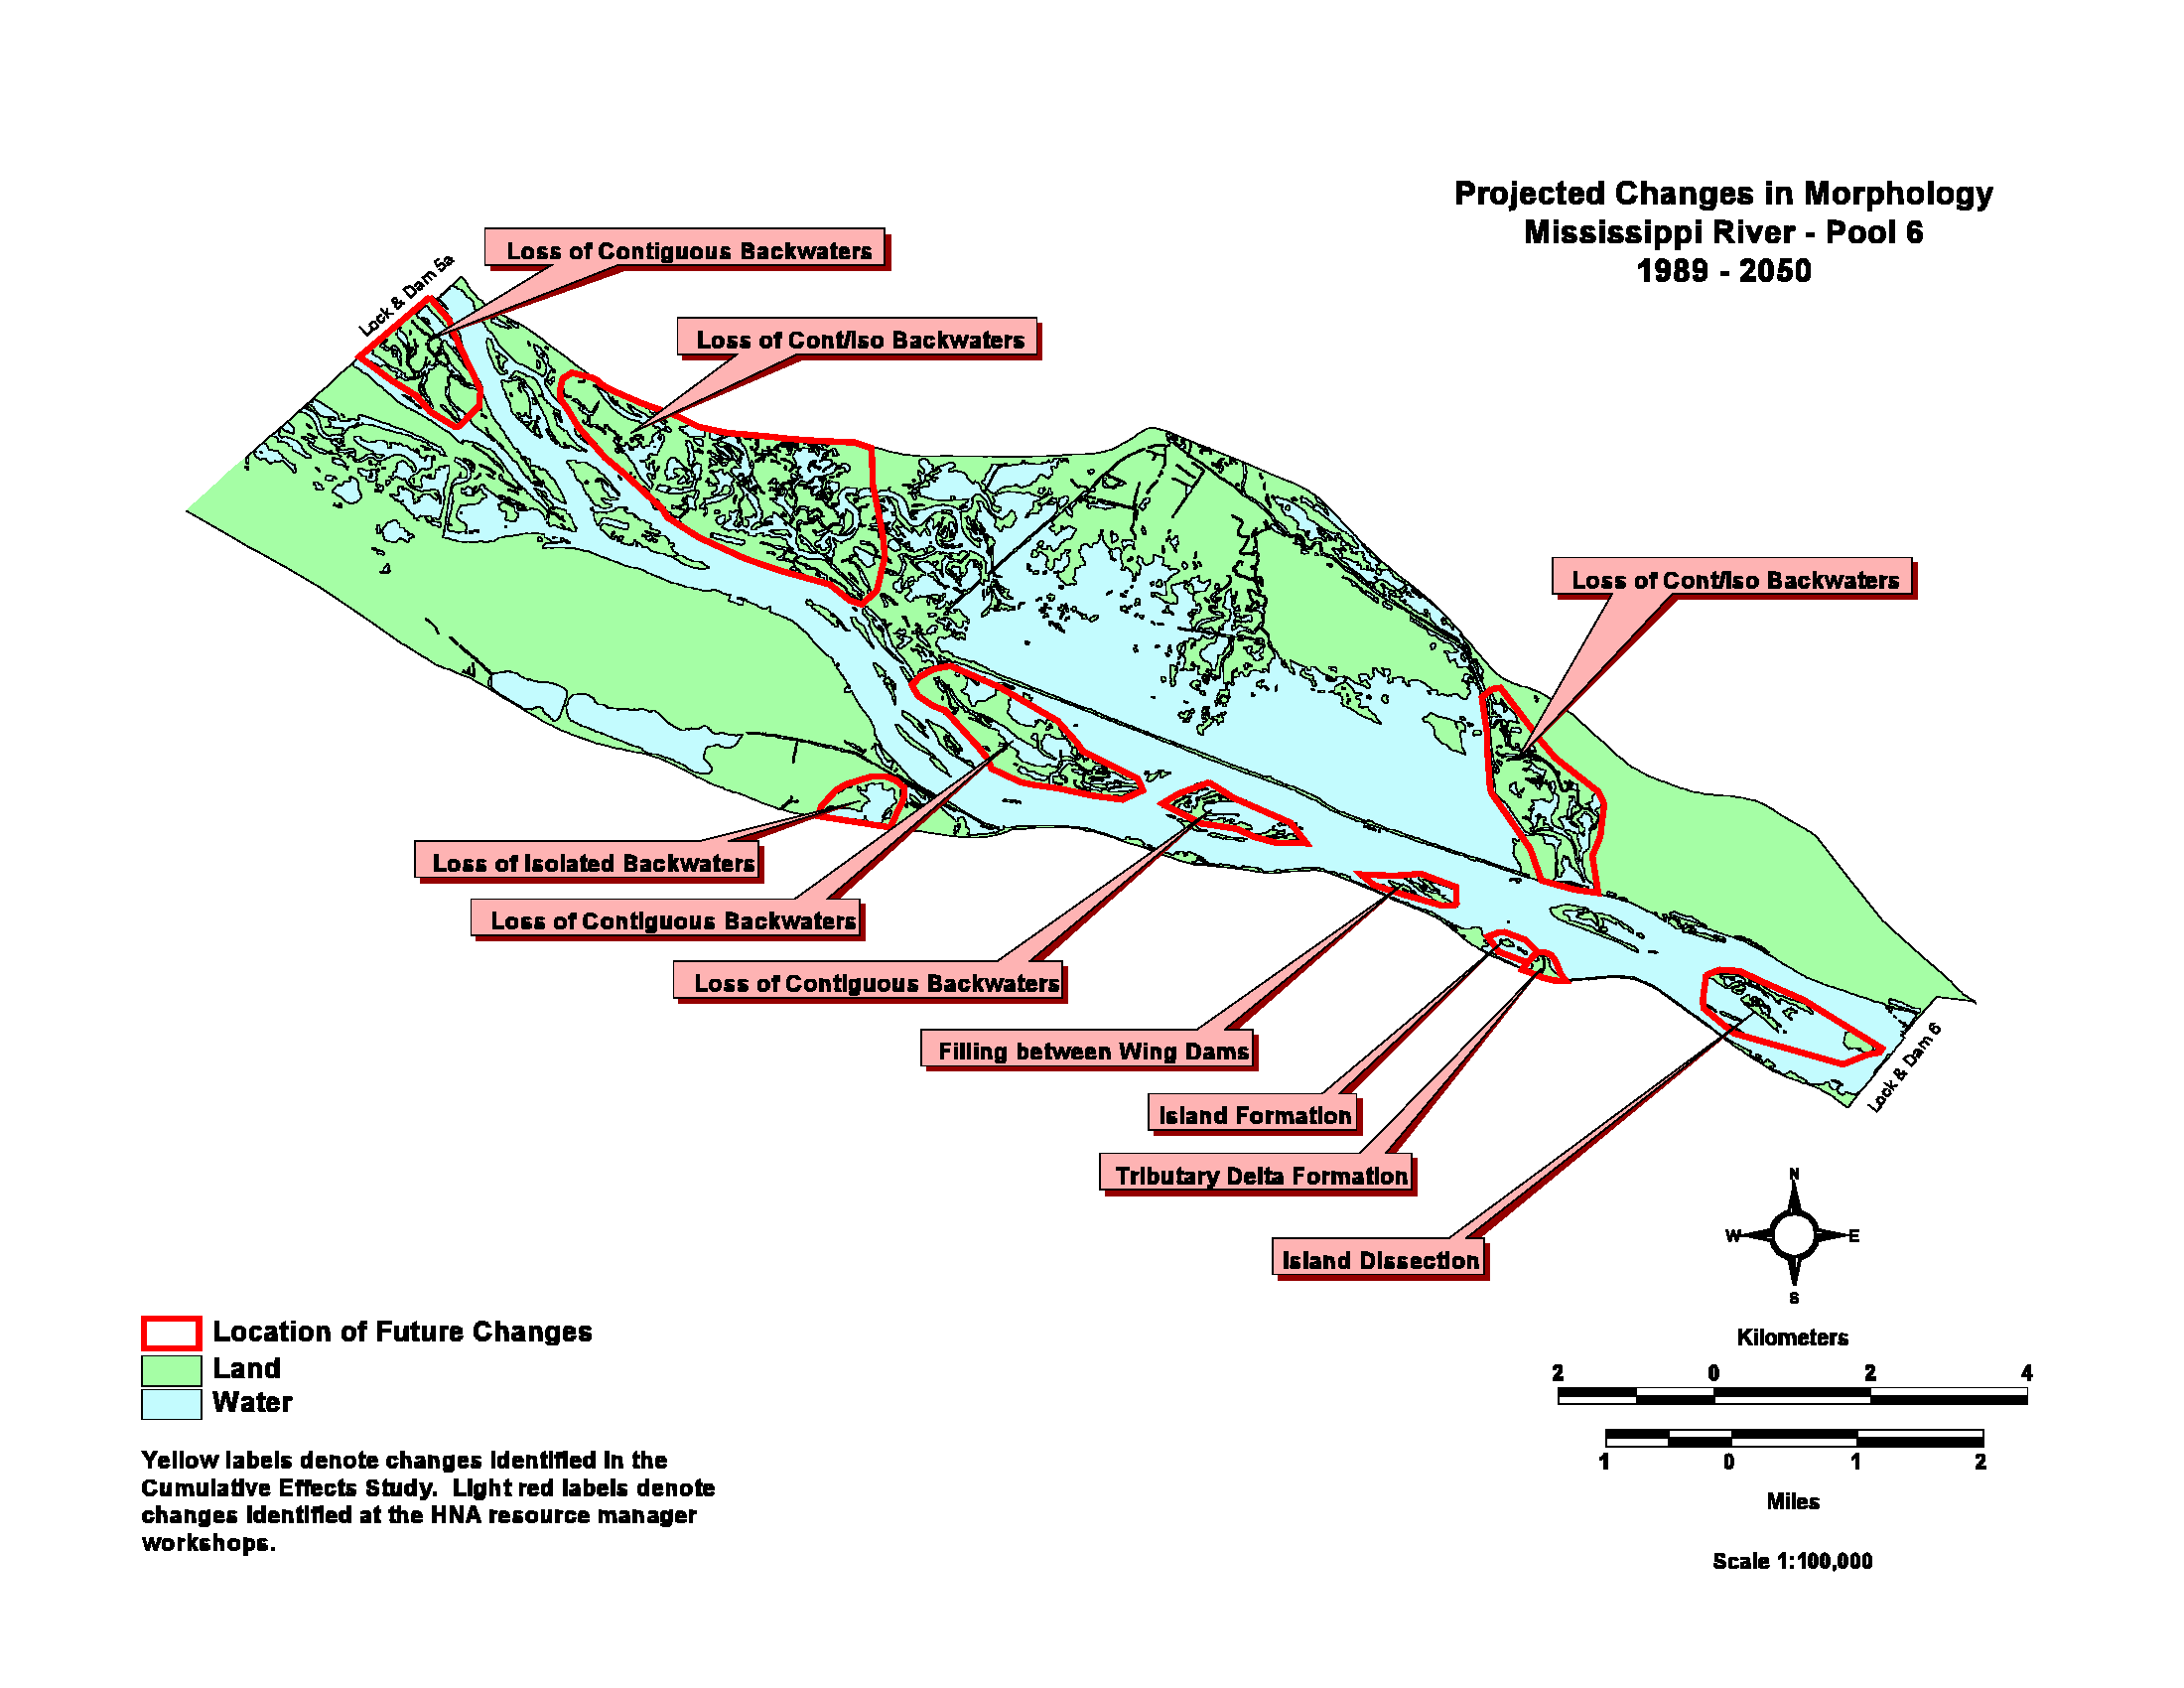 HNA_Predicted_Geomorphology_Pool_6.png – The Upper Mississippi River Habitat Needs Assessment surveyed river managers to provide site-specific details to augment prior remote sensing assessments of future geomorphic change. The product of four workshops distributed throughout the UMRS was an attributed, pool-scale map set identifying locations of anticipated change and the geomorphic process responsible for identified changes. These and other results of the Habitat Needs Assessment can be obtained at: http://www.umesc.usgs.gov/habitat_needs_assessment/emp_hna.html
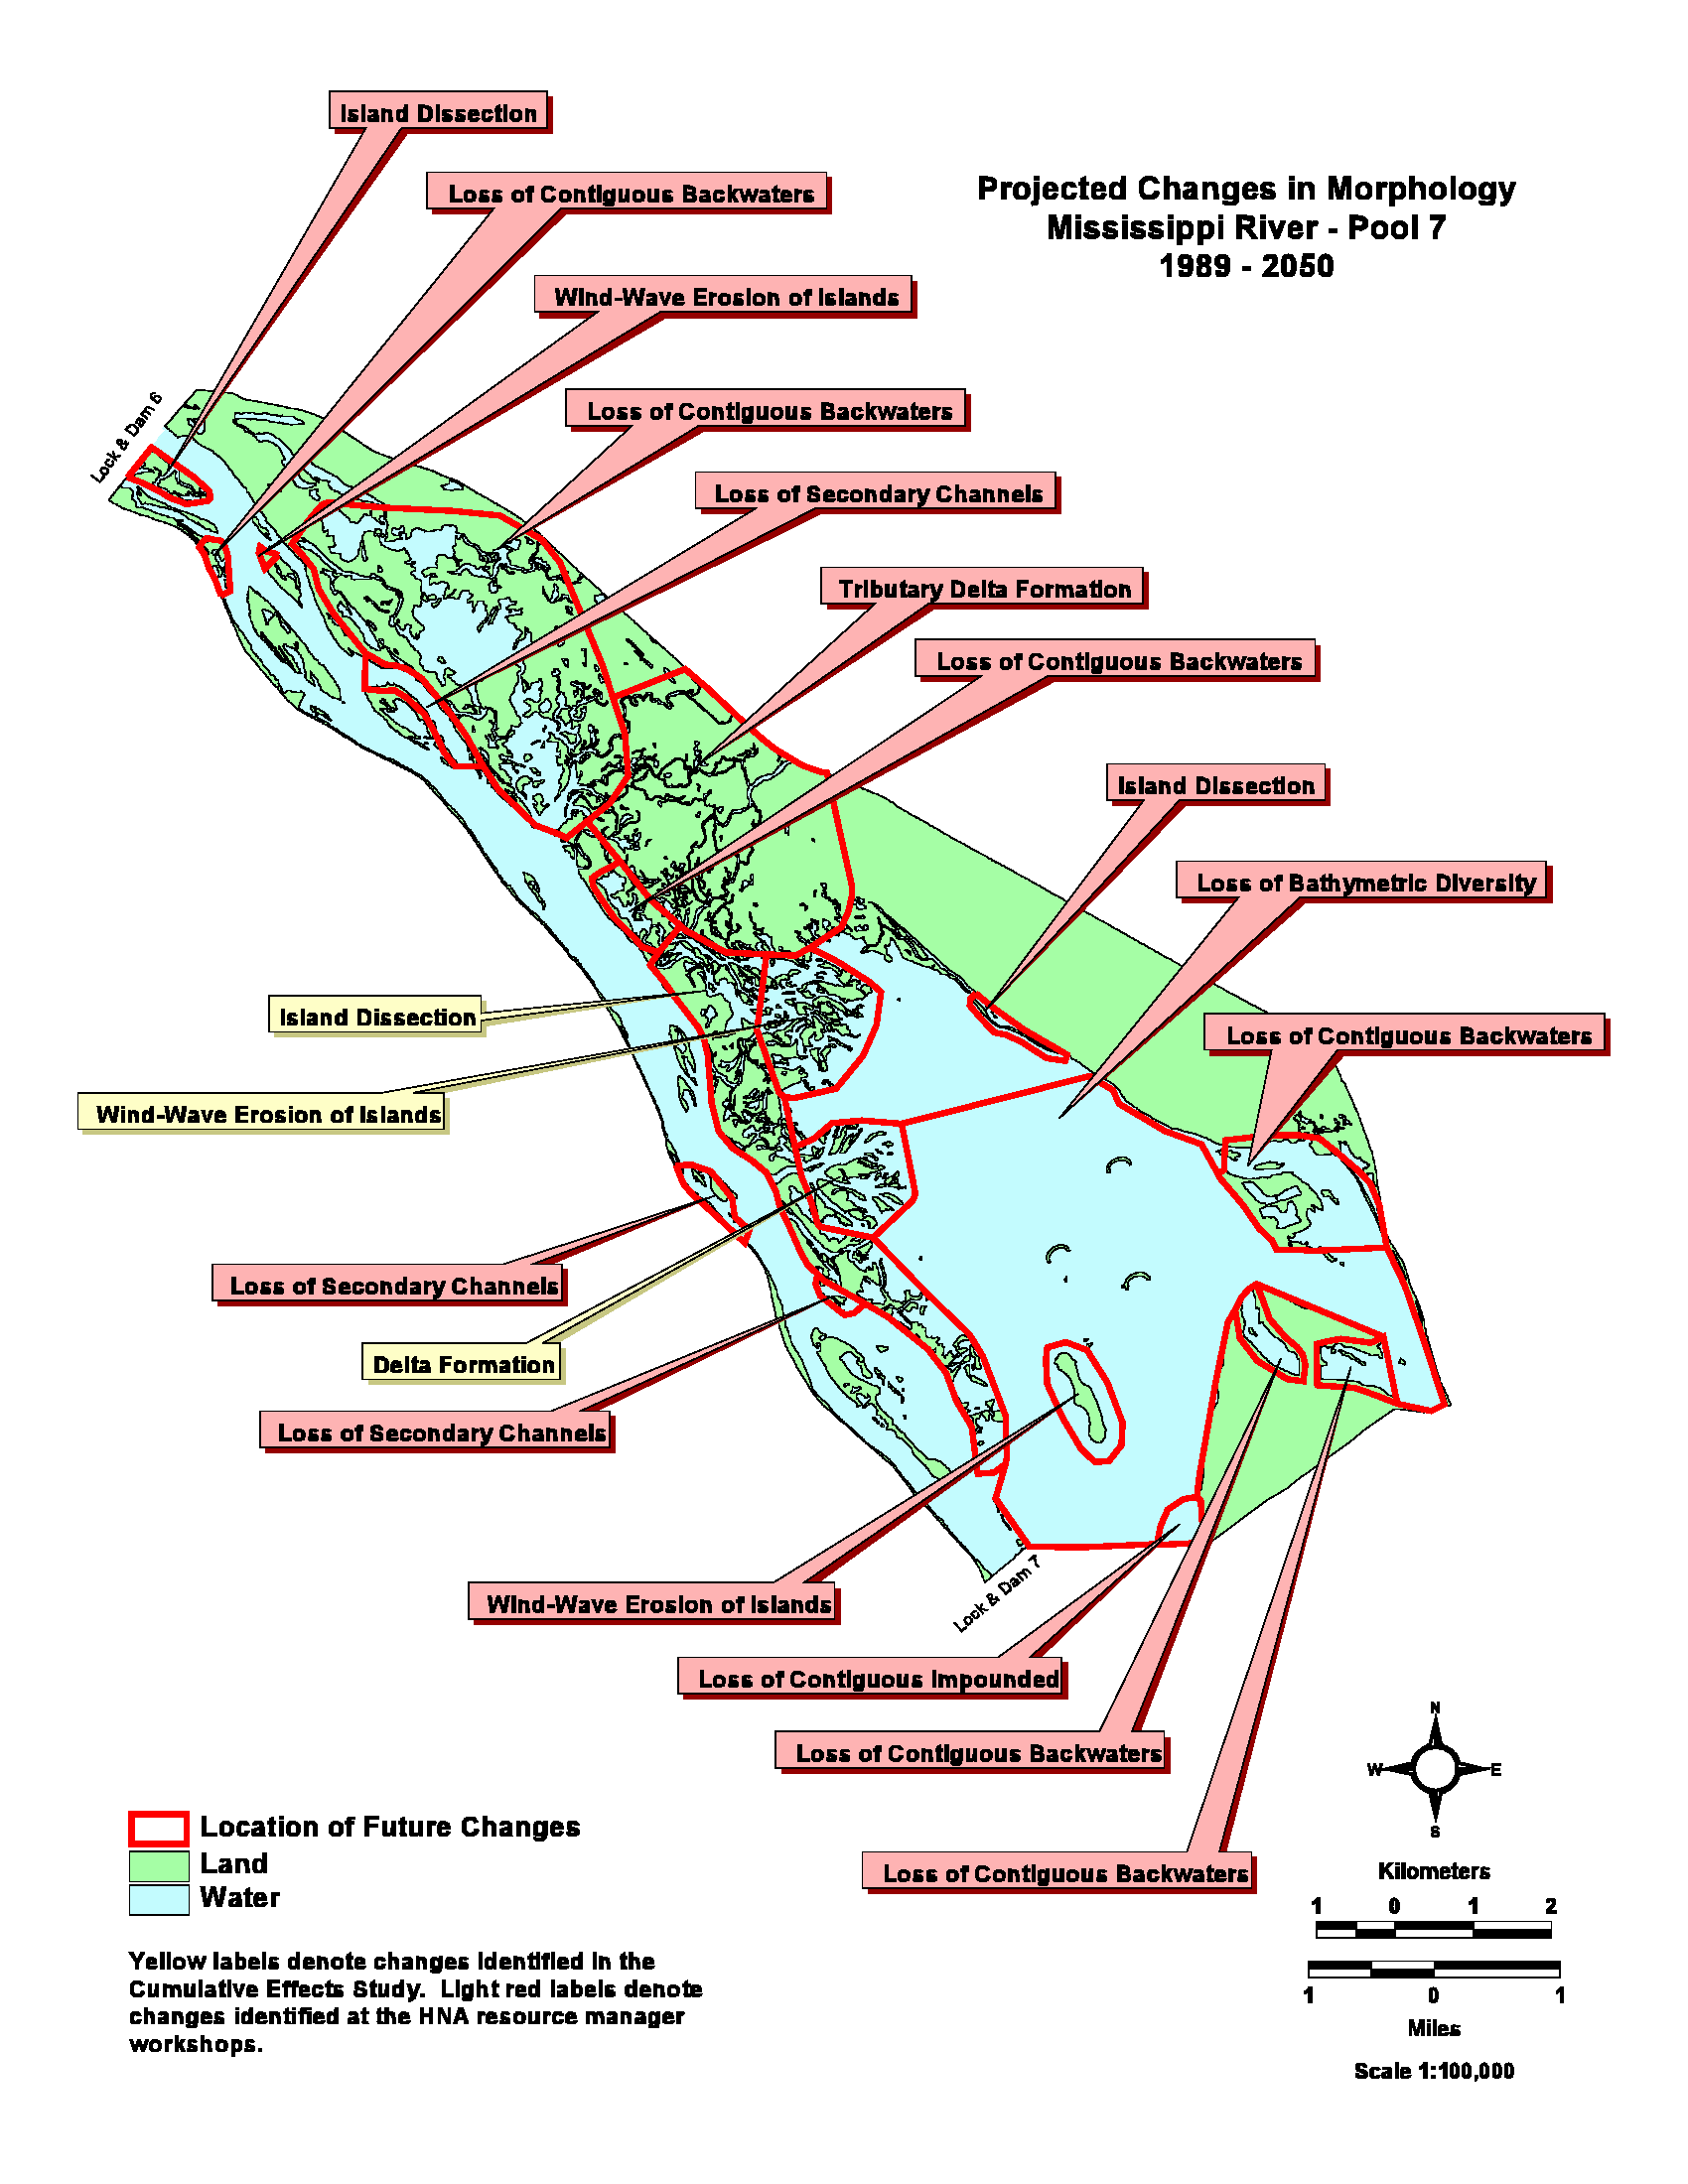 HNA_Predicted_Geomorphology_Pool_7.png – The Upper Mississippi River Habitat Needs Assessment surveyed river managers to provide site-specific details to augment prior remote sensing assessments of future geomorphic change. The product of four workshops distributed throughout the UMRS was an attributed, pool-scale map set identifying locations of anticipated change and the geomorphic process responsible for identified changes. These and other results of the Habitat Needs Assessment can be obtained at: http://www.umesc.usgs.gov/habitat_needs_assessment/emp_hna.html
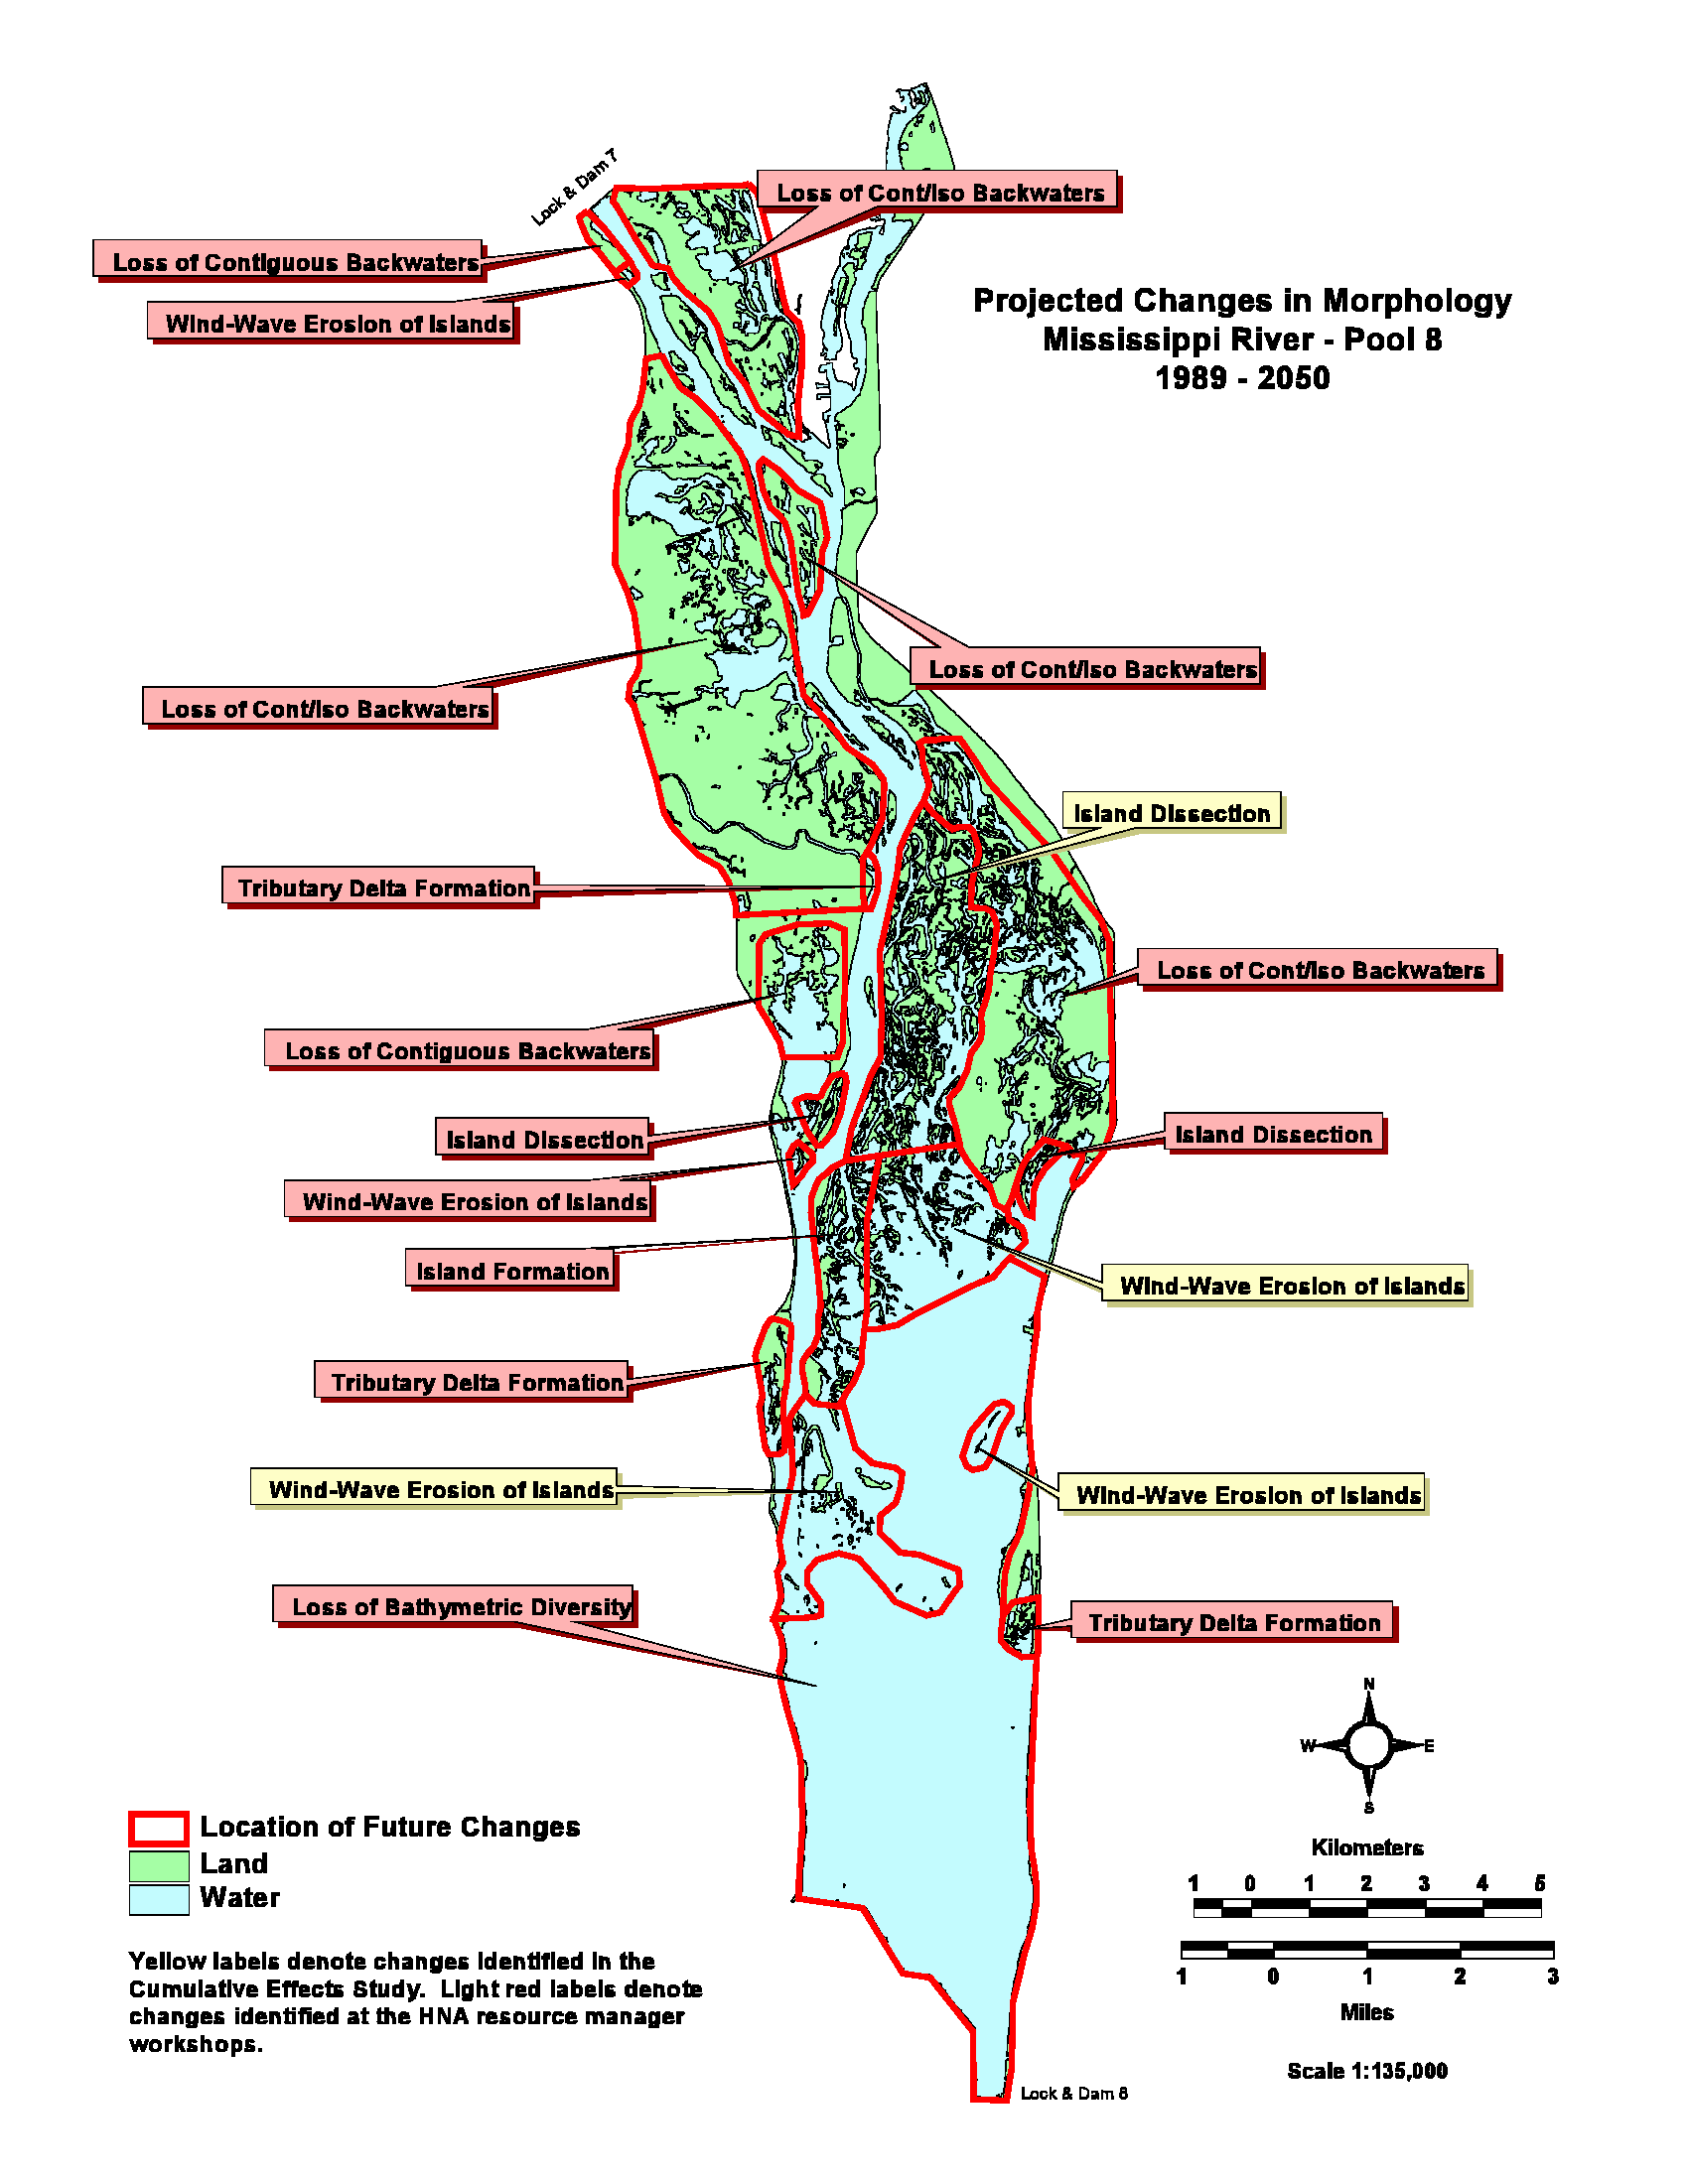 HNA_Predicted_Geomorphology_Pool_8.png – The Upper Mississippi River Habitat Needs Assessment surveyed river managers to provide site-specific details to augment prior remote sensing assessments of future geomorphic change. The product of four workshops distributed throughout the UMRS was an attributed, pool-scale map set identifying locations of anticipated change and the geomorphic process responsible for identified changes. These and other results of the Habitat Needs Assessment can be obtained at: http://www.umesc.usgs.gov/habitat_needs_assessment/emp_hna.html
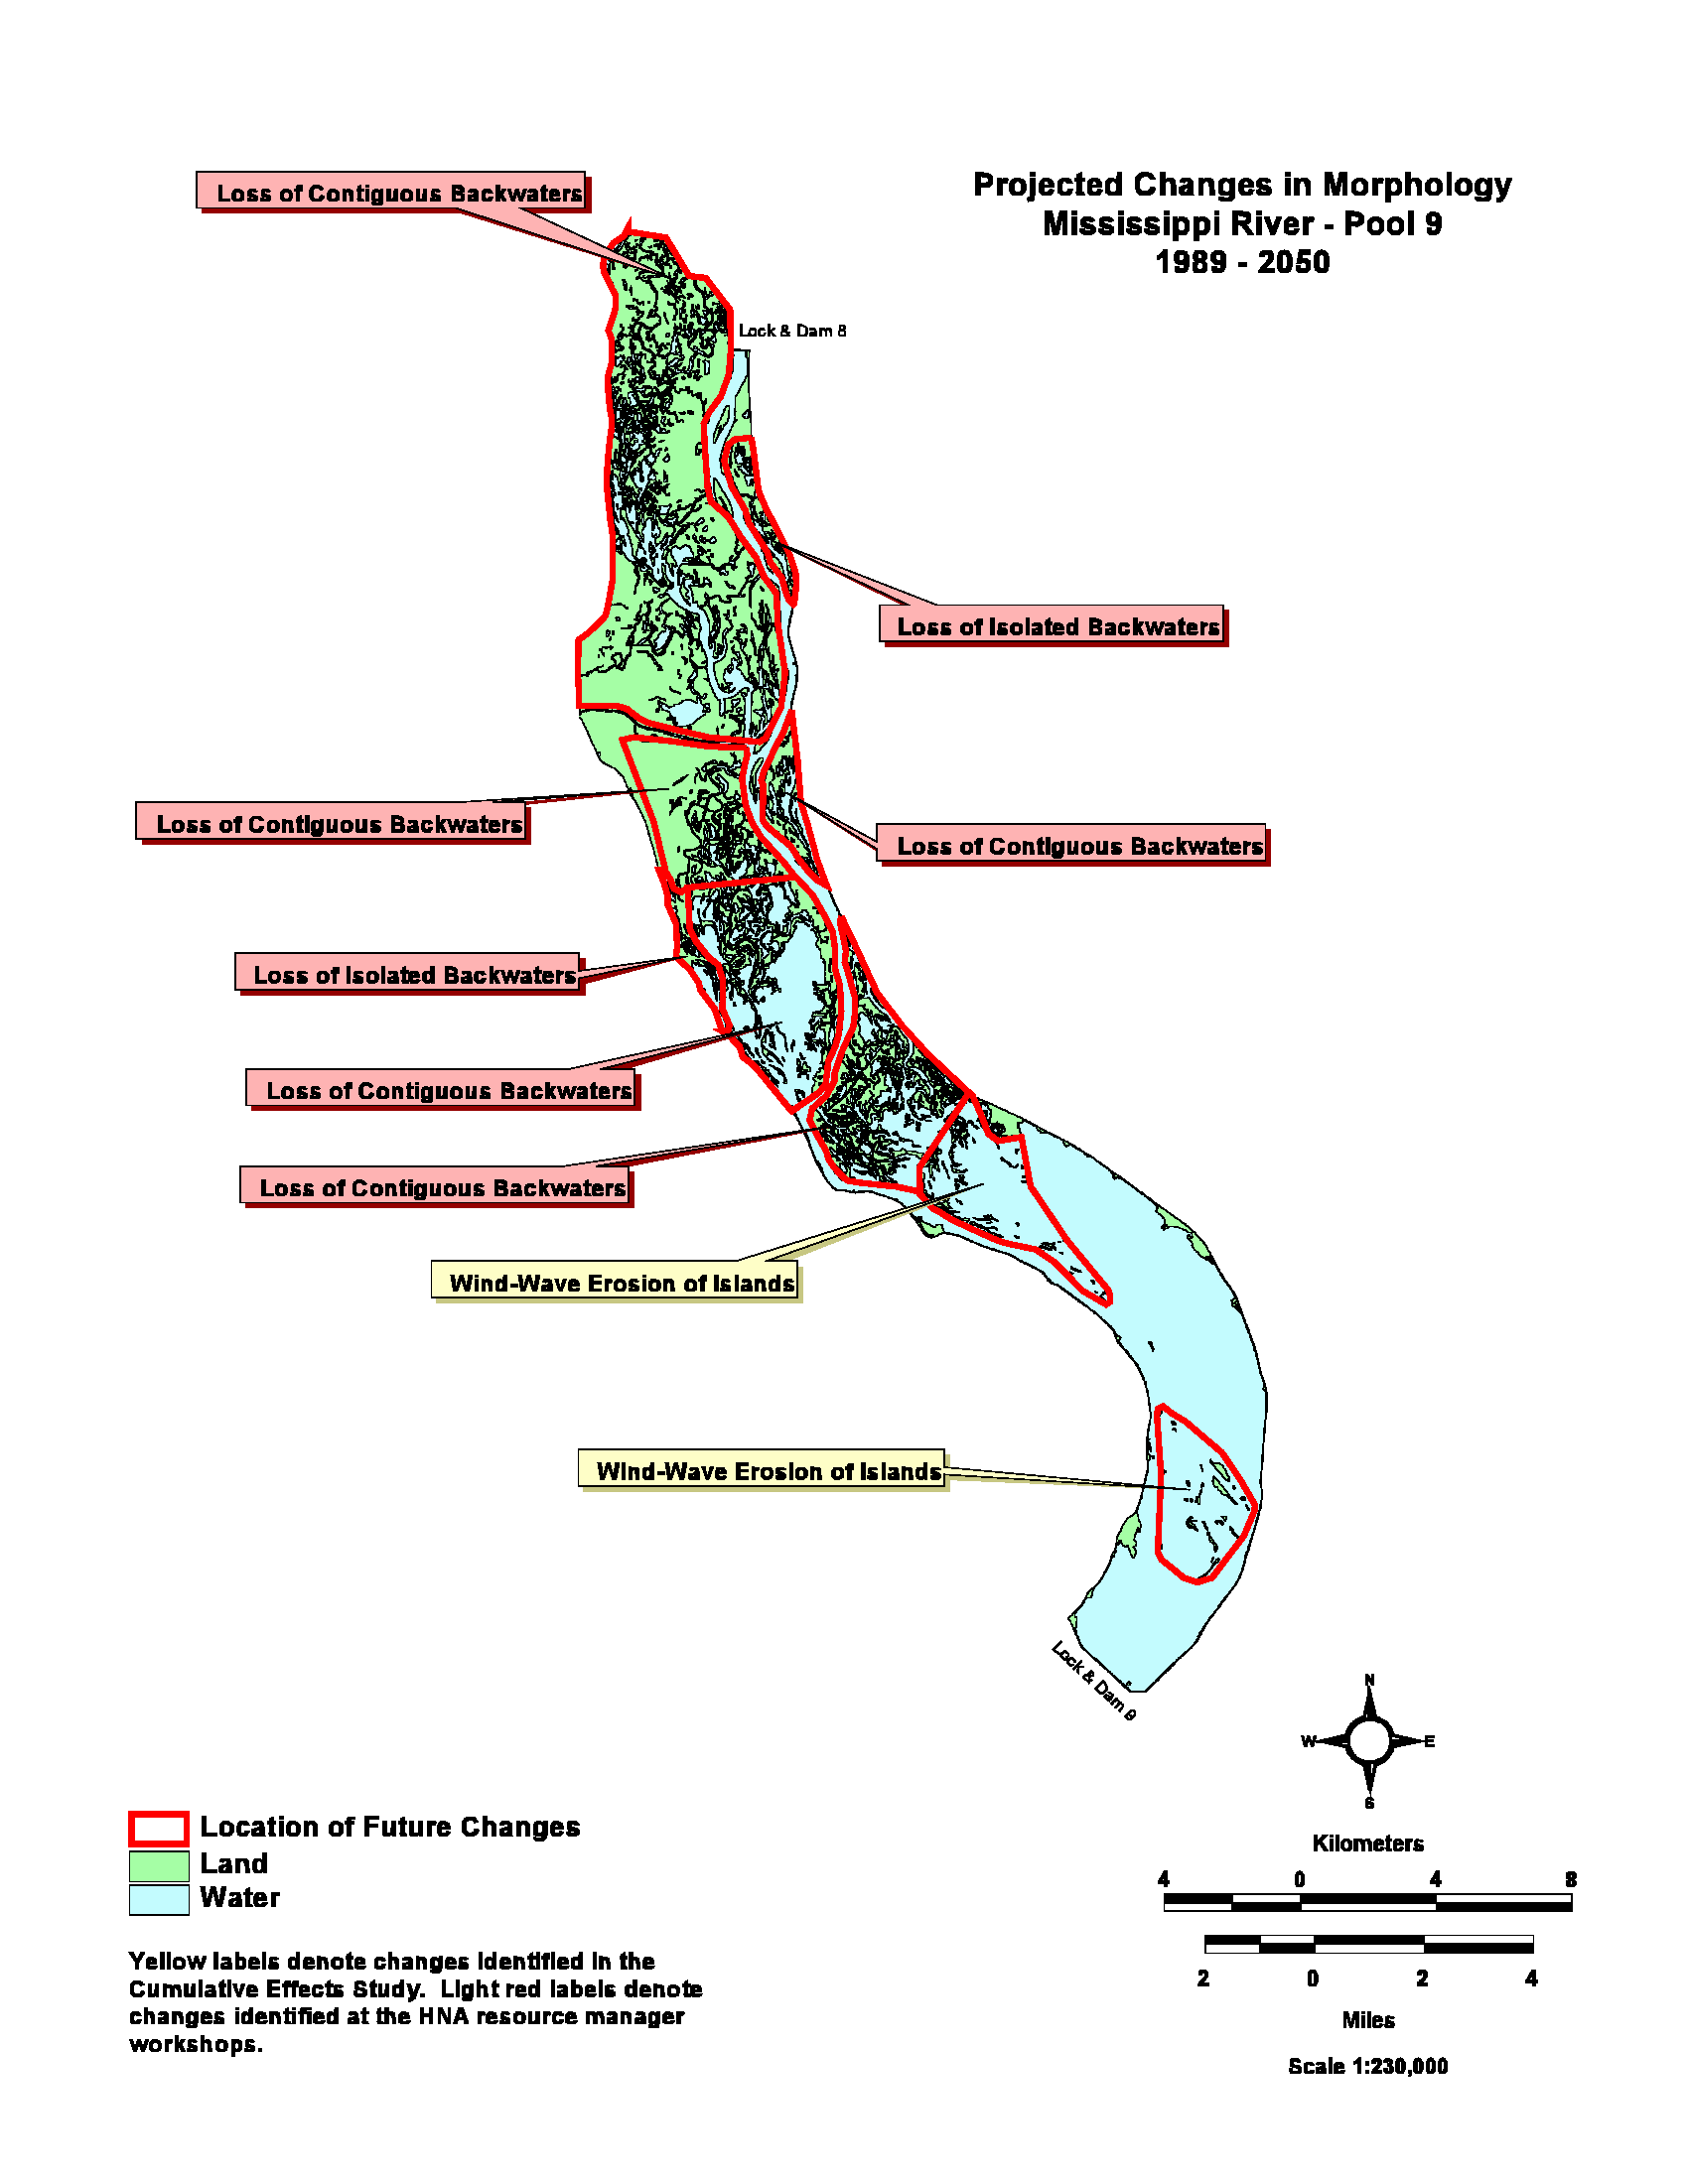 HNA_Predicted_Geomorphology_Pool_9.png – The Upper Mississippi River Habitat Needs Assessment surveyed river managers to provide site-specific details to augment prior remote sensing assessments of future geomorphic change. The product of four workshops distributed throughout the UMRS was an attributed, pool-scale map set identifying locations of anticipated change and the geomorphic process responsible for identified changes. These and other results of the Habitat Needs Assessment can be obtained at: http://www.umesc.usgs.gov/habitat_needs_assessment/emp_hna.html
2. Hydrology/1. Long Term Stage Hydrograph
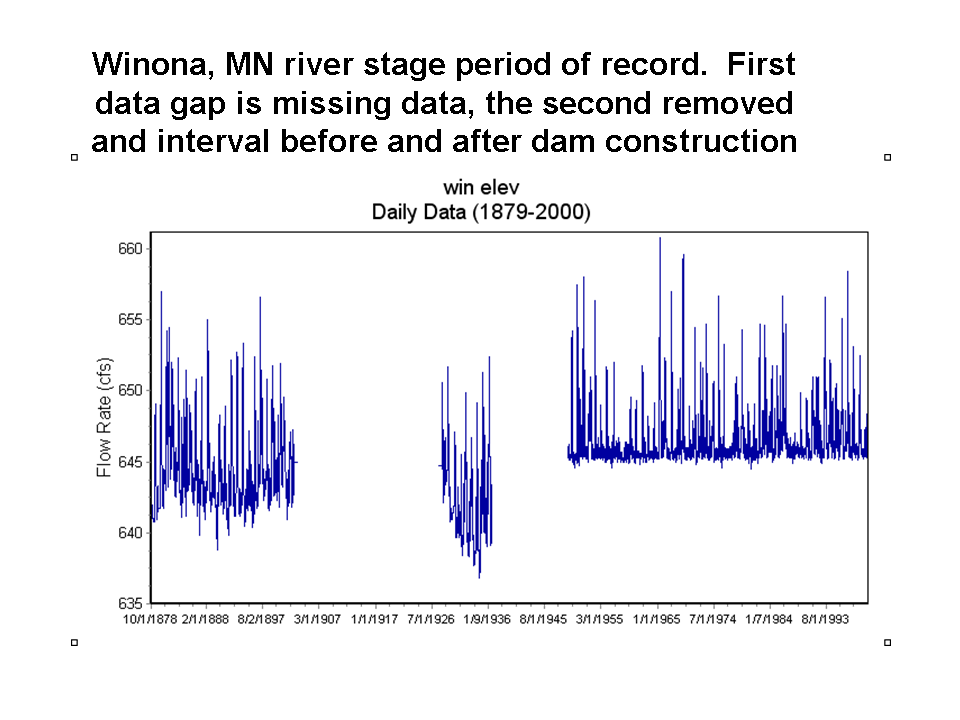 Long_Term_Stage_Winona.png – The U.S. Army Corps of Engineers and U.S. Geological Survey have maintained river stage gauges throughout the Upper Mississippi River System since the 1860s. Early records are widely distributed, but the Winona, Minnesota (Pool 6 Control Point, Geomorphic Reach 3) gauge is one of the longer term sites, having been established in 1878. There is a pre-dam data gap, and in the plot data around the time of dam completion and early operation were removed. This image shows long term daily river stage data at the river stage gauge at Winona, Minnesota.
2. Hydrology/2. Within-Pool Stage Hydrograph/
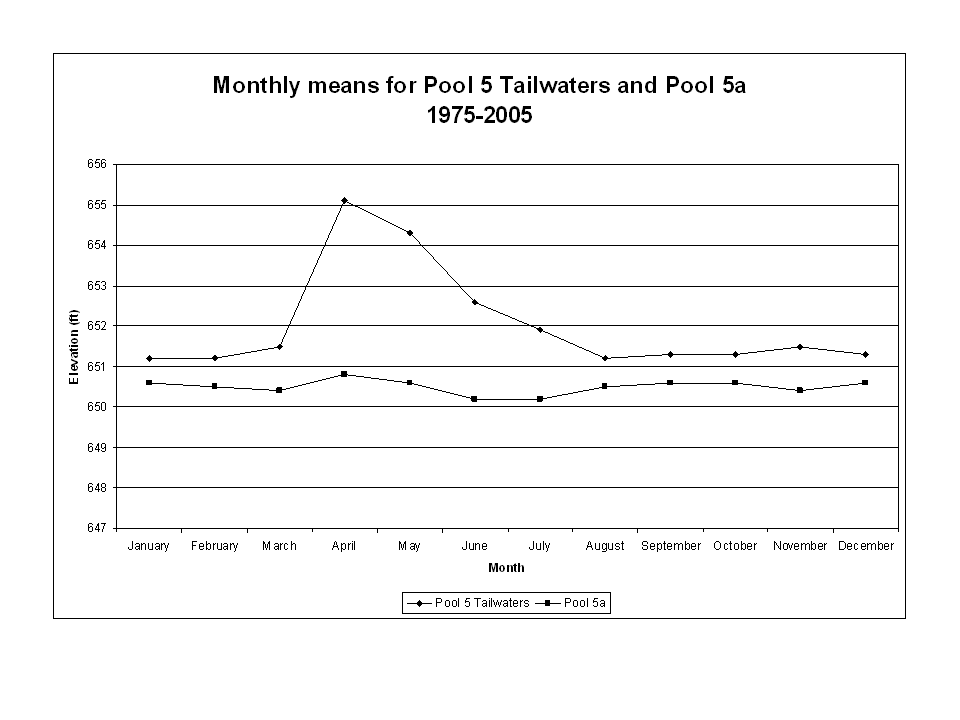
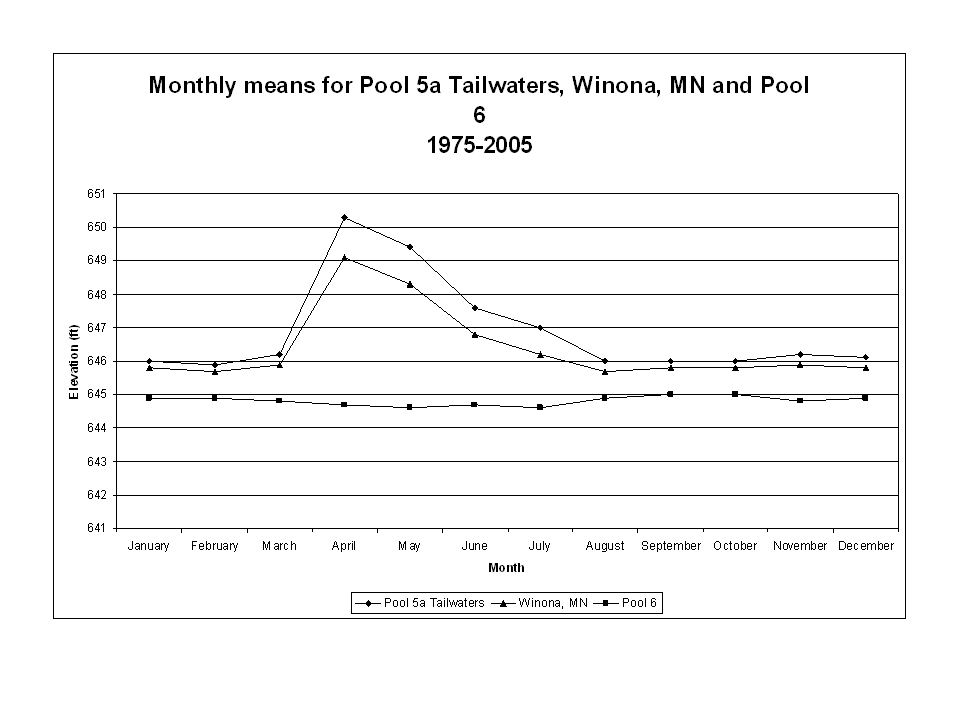
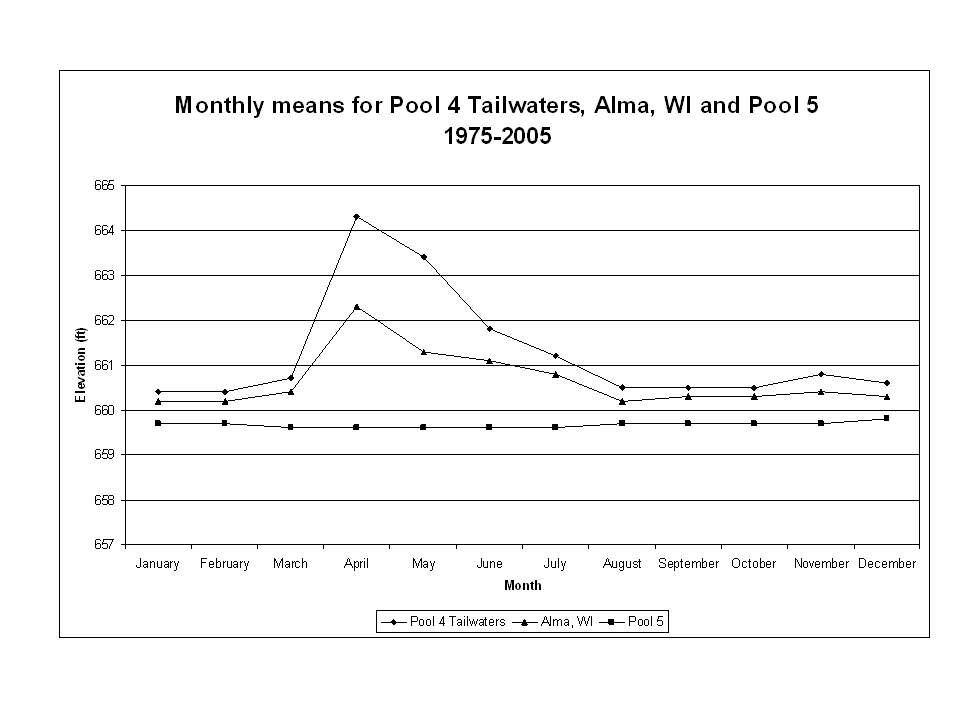 Within-pool_Stage_Pool_5.PNG – Water surface elevations (river stage) respond fairly directly with river discharge in undisturbed systems, but dams are designed to regulate river stage. Mississippi dams only regulate the moderate to low flow end of the annual hydrograph and dam gates are removed when flow is sufficient to maintain navigable depths. River stage between two dams varies depending on the influence of the lower dam. Upper Pool gauges (tailwater) respond relatively naturally to flow, mid-pool gauge variation is truncated, and lower pool stage (Pool) variation may even be negative because of the operations of the dams at moderate discharge.
 Within-pool_Stage_Pool_5a.PNG – Water surface elevations (river stage) respond fairly directly with river discharge in undisturbed systems, but dams are designed to regulate river stage. Mississippi dams only regulate the moderate to low flow end of the annual hydrograph and dam gates are removed when flow is sufficient to maintain navigable depths. River stage between two dams varies depending on the influence of the lower dam. Upper Pool gauges (tailwater) respond relatively naturally to flow, mid-pool gauge variation is truncated, and lower pool stage (Pool) variation may even be negative because of the operations of the dams at moderate discharge.
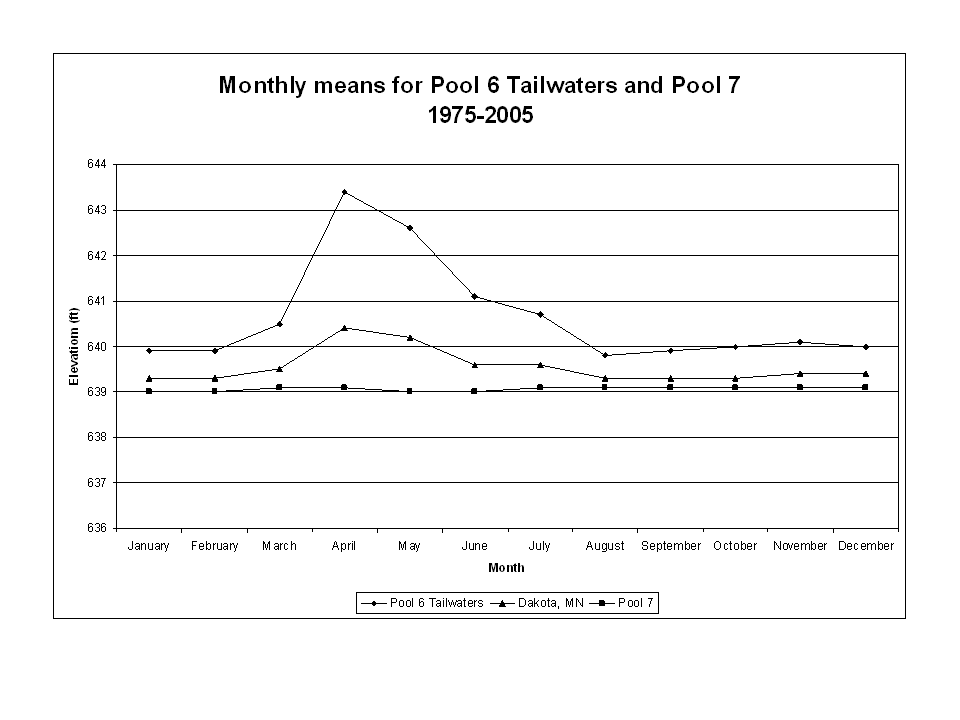
 Within-pool_Stage_Pool_6.PNG – Water surface elevations (river stage) respond fairly directly with river discharge in undisturbed systems, but dams are designed to regulate river stage. Mississippi dams only regulate the moderate to low flow end of the annual hydrograph and dam gates are removed when flow is sufficient to maintain navigable depths. River stage between two dams varies depending on the influence of the lower dam. Upper Pool gauges (tailwater) respond relatively naturally to flow, mid-pool gauge variation is truncated, and lower pool stage (Pool) variation may even be negative because of the operations of the dams at moderate discharge.
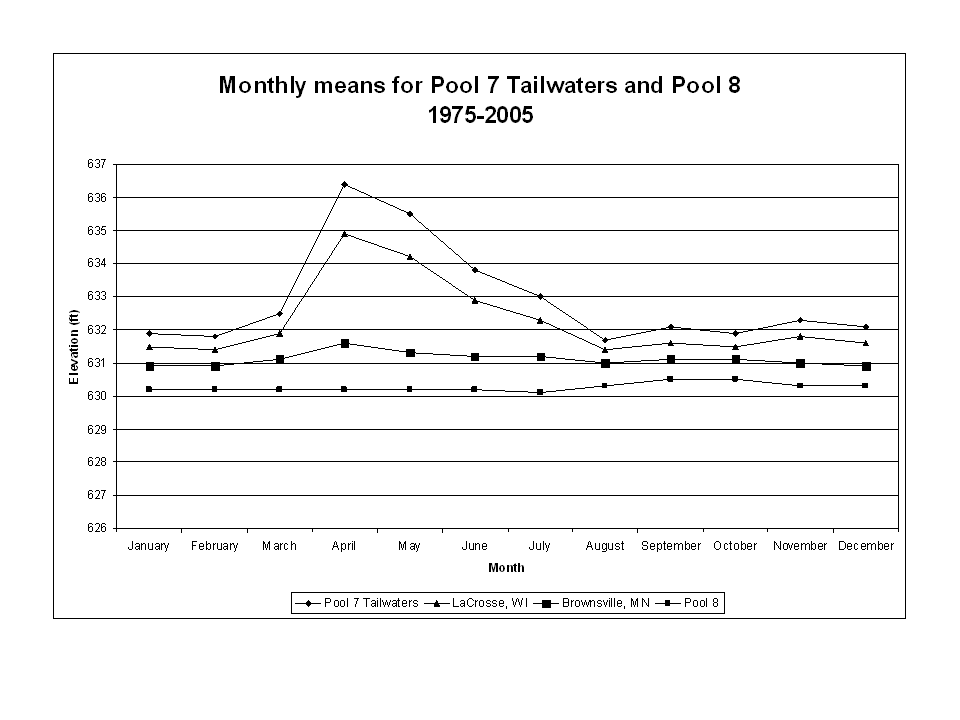
 Within-pool_Stage_Pool_7.PNG – Water surface elevations (river stage) respond fairly directly with river discharge in undisturbed systems, but dams are designed to regulate river stage. Mississippi dams only regulate the moderate to low flow end of the annual hydrograph and dam gates are removed when flow is sufficient to maintain navigable depths. River stage between two dams varies depending on the influence of the lower dam. Upper Pool gauges (tailwater) respond relatively naturally to flow, mid-pool gauge variation is truncated, and lower pool stage (Pool) variation may even be negative because of the operations of the dams at moderate discharge.
 Within-pool_Stage_Pool_8.PNG – Water surface elevations (river stage) respond fairly directly with river discharge in undisturbed systems, but dams are designed to regulate river stage. Mississippi dams only regulate the moderate to low flow end of the annual hydrograph and dam gates are removed when flow is sufficient to maintain navigable depths. River stage between two dams varies depending on the influence of the lower dam. Upper Pool gauges (tailwater) respond relatively naturally to flow, mid-pool gauge variation is truncated, and lower pool stage (Pool) variation may even be negative because of the operations of the dams at moderate discharge.
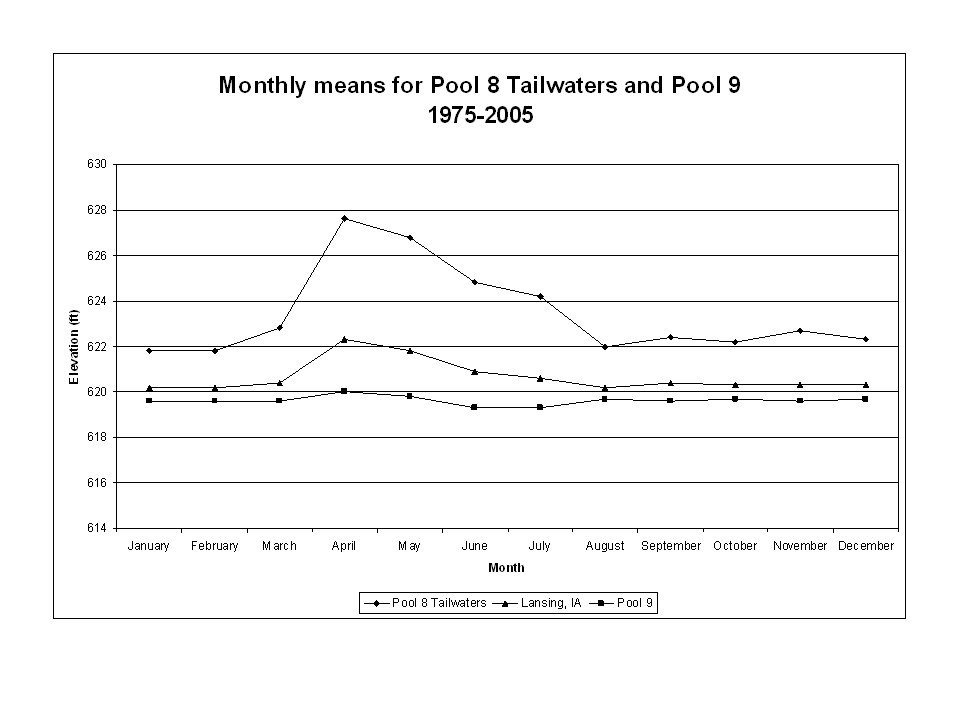 Within-pool_Stage_Pool_9.PNG – Water surface elevations (river stage) respond fairly directly with river discharge in undisturbed systems, but dams are designed to regulate river stage. Mississippi dams only regulate the moderate to low flow end of the annual hydrograph and dam gates are removed when flow is sufficient to maintain navigable depths. River stage between two dams varies depending on the influence of the lower dam. Upper Pool gauges (tailwater) respond relatively naturally to flow, mid-pool gauge variation is truncated, and lower pool stage (Pool) variation may even be negative because of the operations of the dams at moderate discharge.
2. Hydrology/ 3. Hydrodynamic Models
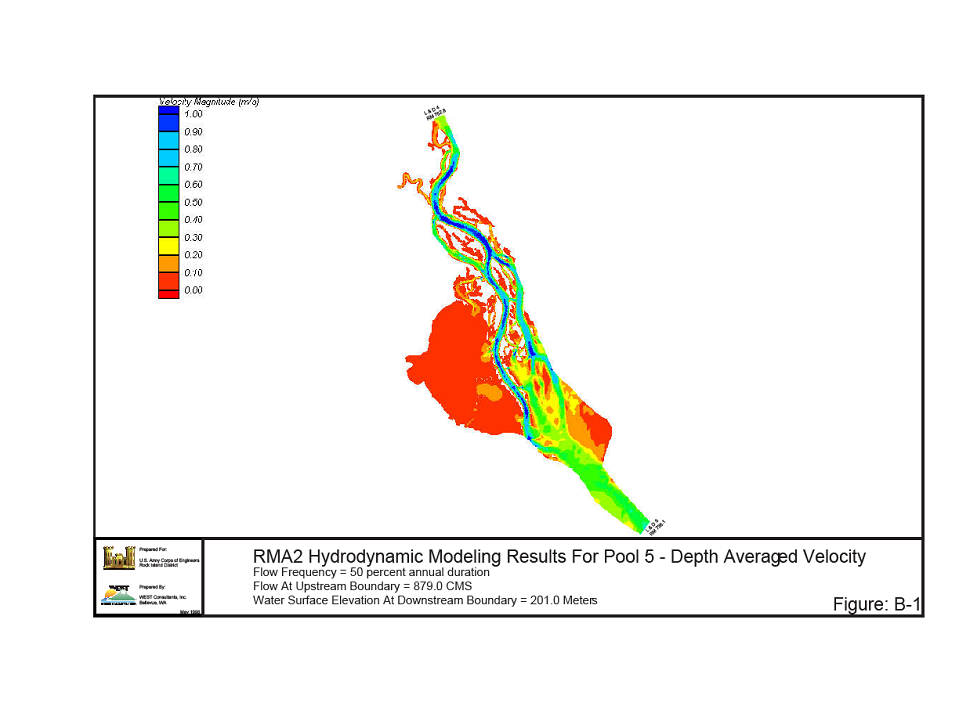 50%_Duration_ RMA2_P5.png – Hydrodynamic models use engineering equations in a finite element model environment to estimate water flow characteristics in a simulated geomorphology for a static discharge. The models are typically run for a series of discharges typical of the site (i.e., low, medium, high flow). The models are helpful to estimate aquatic habitat characteristics in river environments. The model environment can be manipulated to simulate environmental response to restoration actions like island construction. This image is a large scale image of Pool 5 current velocities at medium flow, much more information is available from the U.S. Army Corps of Engineers, St. Paul District. Jon Hendrickson is the Hydraulic Engineer Point of Contact (jon.s.hendrickson@usace.army.mil)
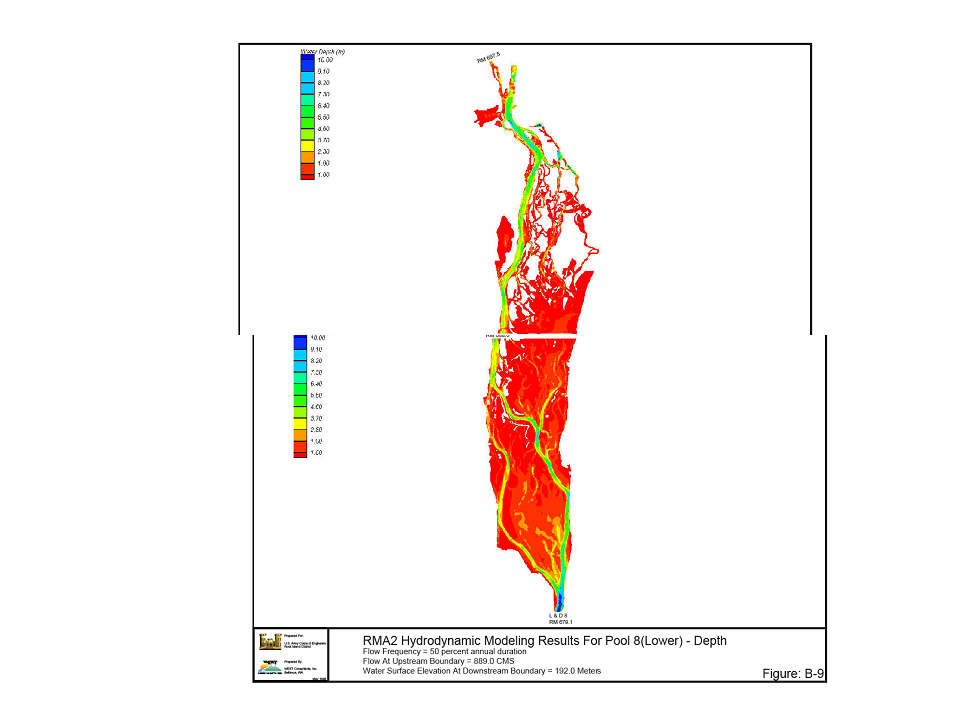 50%_Duration_ RMA2_P8.png – Hydrodynamic models use engineering equations in a finite element model environment to estimate water flow characteristics in a simulated geomorphology for a static discharge. The models are typically run for a series of discharges typical of the site (i.e., low, medium, high flow). The models are helpful to estimate aquatic habitat characteristics in river environments. The model environment can be manipulated to simulate environmental response to restoration actions like island construction. This image is a large scale image of Pool 8 current velocities at medium flow, much more information is available from the U.S. Army Corps of Engineers, St. Paul District. Jon Hendrickson is the Hydraulic Engineer Point of Contact (jon.s.hendrickson@usace.army.mil)
3. Biogeochemistry
Biogeochemistry (transport and cycling of sediments and nutrients; water quality).
The dynamics of sediments and nutrients are defined by their inputs, transportation (including erosion, deposition, and export), and storage. Large inputs to rivers of sediments and nutrients typically occur during extreme flow events, and are therefore linked to the hydrologic and geomorphic processes. Within the UMRS, many of these processes have been affected by human modifications to the river and its floodplain. Inputs of sediments and nutrients from tributaries depend largely on management of the watershed and dams on tributaries, which are beyond the control of NESP. However, management actions within the river channel and floodplain can have substantial effects on the distribution and dynamics of these materials. Water quality is included under this category because it is greatly influenced by sediments and nutrients. Restoring processes that input, transport, assimilate, and output materials within the UMRB will undoubtedly result in measurable improvements in site-specific water quality.
Biogeochemical information is maintained by several state and Federal agencies. The U.S. Geological Survey Upper Midwest Environmental Science Center and Long Term Resource Monitoring Program participate in several basin-scale programs. EPA, USDA-NRCS, and USGS Water Resources Division also maintain extensive basin-scale data networks.
USGS-UMESC
Nutrient Loading and Effects: http://www.umesc.usgs.gov/aquatic/nutrients.html
Effects of Contaminants: http://www.umesc.usgs.gov/aquatic/contaminants.html
Water Elevation and Discharge Data: http://www.umesc.usgs.gov/data_library/water_elevation/water_elevation_page.html#projects
Sediments, Contaminants, and Nutrients: http://www.umesc.usgs.gov/data_library/sed_cont_nutrients.htmlWater Quality Data: http://www.umesc.usgs.gov/data_library/water_quality/water_quality_page.html
Water Quality Reports: http://www.umesc.usgs.gov/reports_publications/ltrmp/water.html
Other Agencies
USGS Watershed Home Page: http://water.usgs.gov/wsc/map_index.html
USEPA Watershed Home Page: http://cfpub.epa.gov/surf/locate/index.cfm
NRCS Water Quality and Water Quantity: http://www.wsi.nrcs.usda.gov/products/W2Q/W2Q_home.html
4. Habitat/1. Presettlement Land Cover Maps
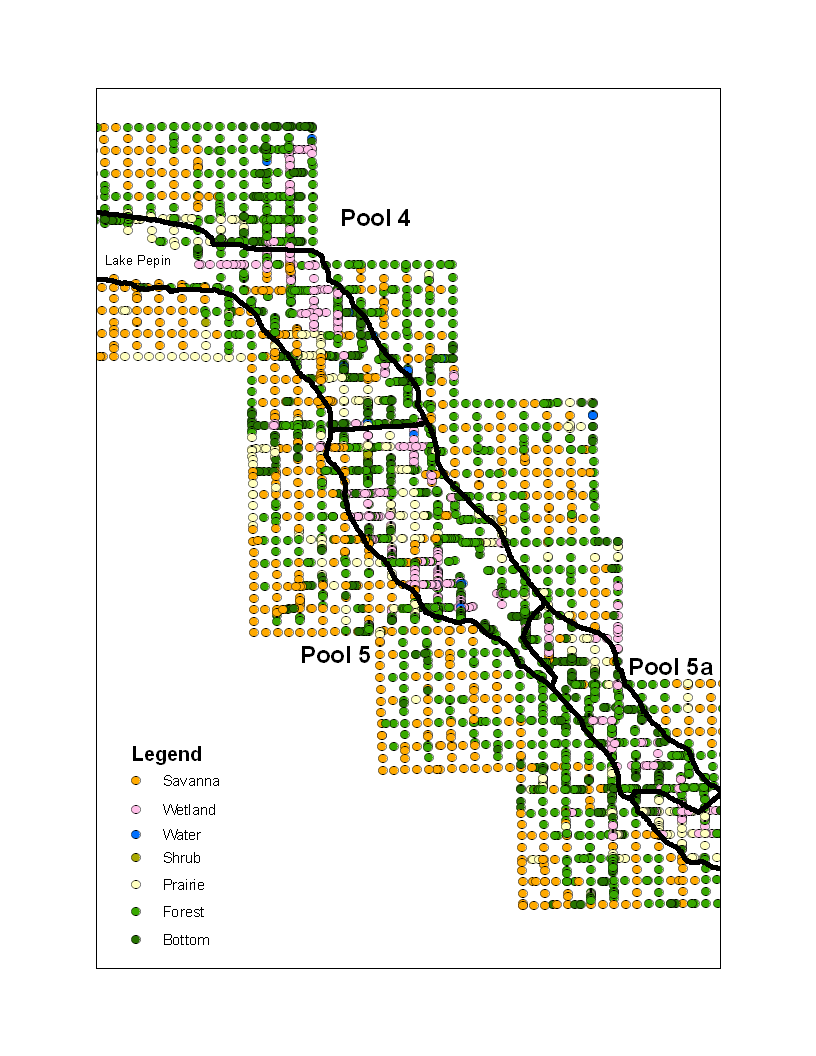 Pool_5&5a_1840s.png – The Public Land Survey was an effort by the U.S. government to survey the mostly unsettled western territories in order to sell land to the westward-expanding population of the United States, beginning in the late 18th century. The survey of the area covered by this project took place between 1806 and 1857. Government Land Office (GLO) surveyors systematically documented land cover and tree species as they established the township and range system. The surveys provide a valuable source of landscape scale information that serve as a baseline reference for documenting change over the last 200 years. The Nature Conservancy (Paul West, The Nature Conservancy, Madison, Wisconsin) has compiled an extraordinary data set of map quadrangles for the entire river valley and adjacent uplands. Many land cover attributes were condensed to the general types: Savanna, Wetland, Water, Shrub, Prairie, Forest, Bottom (see GLO_Ecotype_crosswalk.xls). The dataset is also attributed with tree species for more intensive forestry analysis. This image depicts land cover ca. 1840 below the Chippewa River delta through Pools 5 and 5a. Data analysis is in progress, questions can be addressed to Chuck Theiling, USACE Rock Island District, Rock Island, Illinois (charles.h.theiling@usace.army.mil).
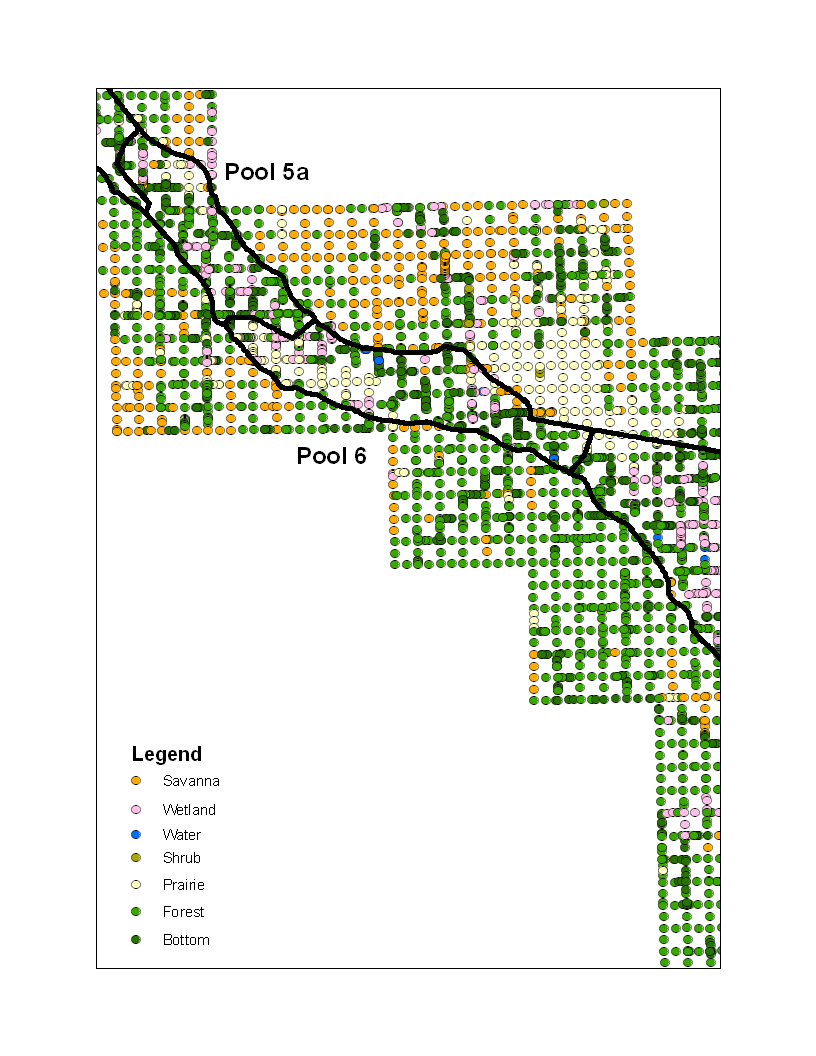 Pool_5a&6_1840s.png – The Public Land Survey was an effort by the U.S. government to survey the mostly unsettled western territories in order to sell land to the westward-expanding population of the United States, beginning in the late 18th century. The survey of the area covered by this project took place between 1806 and 1857. Government Land Office (GLO) surveyors systematically documented land cover and tree species as they established the township and range system. The surveys provide a valuable source of landscape scale information that serve as a baseline reference for documenting change over the last 200 years. The Nature Conservancy (Paul West, The Nature Conservancy, Madison, Wisconsin) has compiled an extraordinary data set of map quadrangles for the entire river valley and adjacent uplands. Many land cover attributes were condensed to the general types: Savanna, Wetland, Water, Shrub, Prairie, Forest, Bottom (see GLO_Ecotype_crosswalk.xls). The dataset is also attributed with tree species for more intensive forestry analysis. This image depicts land cover ca. 1840 in Pools 5a and 6. Data analysis is in progress, questions can be addressed to Chuck Theiling, USACE Rock Island District, Rock Island, Illinois (charles.h.theiling@usace.army.mil).
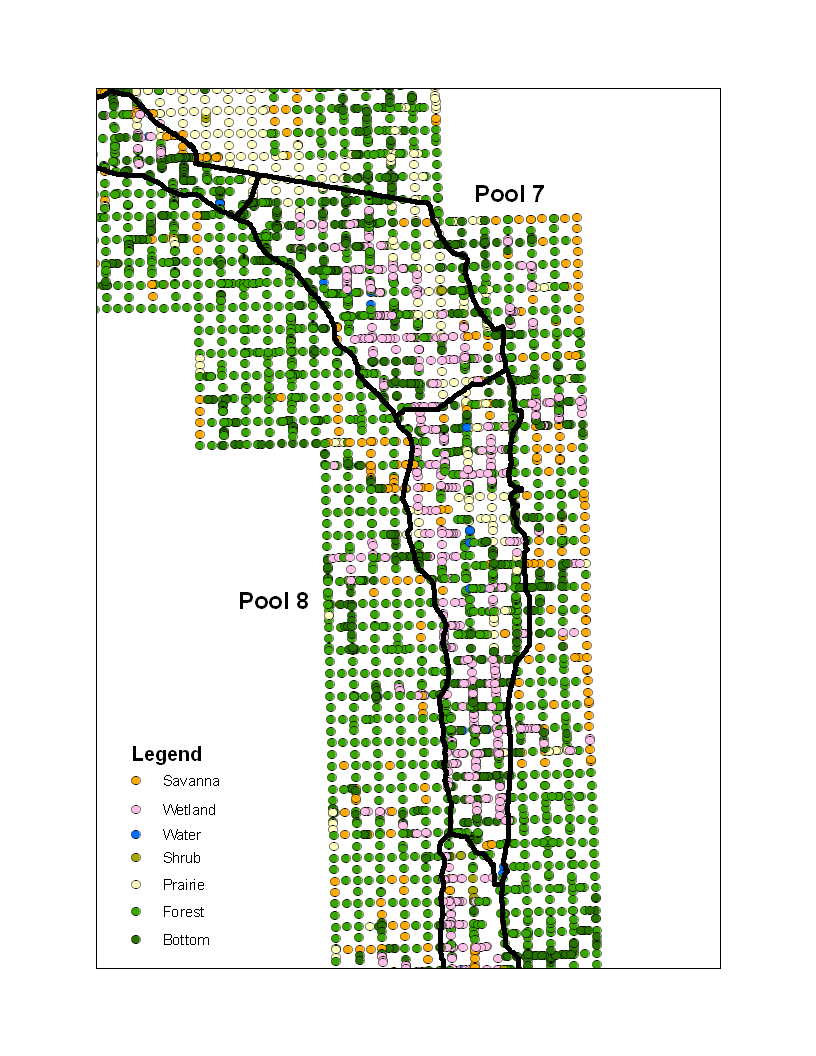 Pool_7&8_1840s.png – The Public Land Survey was an effort by the U.S. government to survey the mostly unsettled western territories in order to sell land to the westward-expanding population of the United States, beginning in the late 18th century. The survey of the area covered by this project took place between 1806 and 1857. Government Land Office (GLO) surveyors systematically documented land cover and tree species as they established the township and range system. The surveys provide a valuable source of landscape scale information that serve as a baseline reference for documenting change over the last 200 years. The Nature Conservancy (Paul West, The Nature Conservancy, Madison, Wisconsin) has compiled an extraordinary data set of map quadrangles for the entire river valley and adjacent uplands. Many land cover attributes were condensed to the general types: Savanna, Wetland, Water, Shrub, Prairie, Forest, Bottom (see GLO_Ecotype_crosswalk.xls). The dataset is also attributed with tree species for more intensive forestry analysis. This image depicts land cover ca. 1840 in Pools 7 and 8. Data analysis is in progress, questions can be addressed to Chuck Theiling, USACE Rock Island District, Rock Island, Illinois (charles.h.theiling@usace.army.mil).
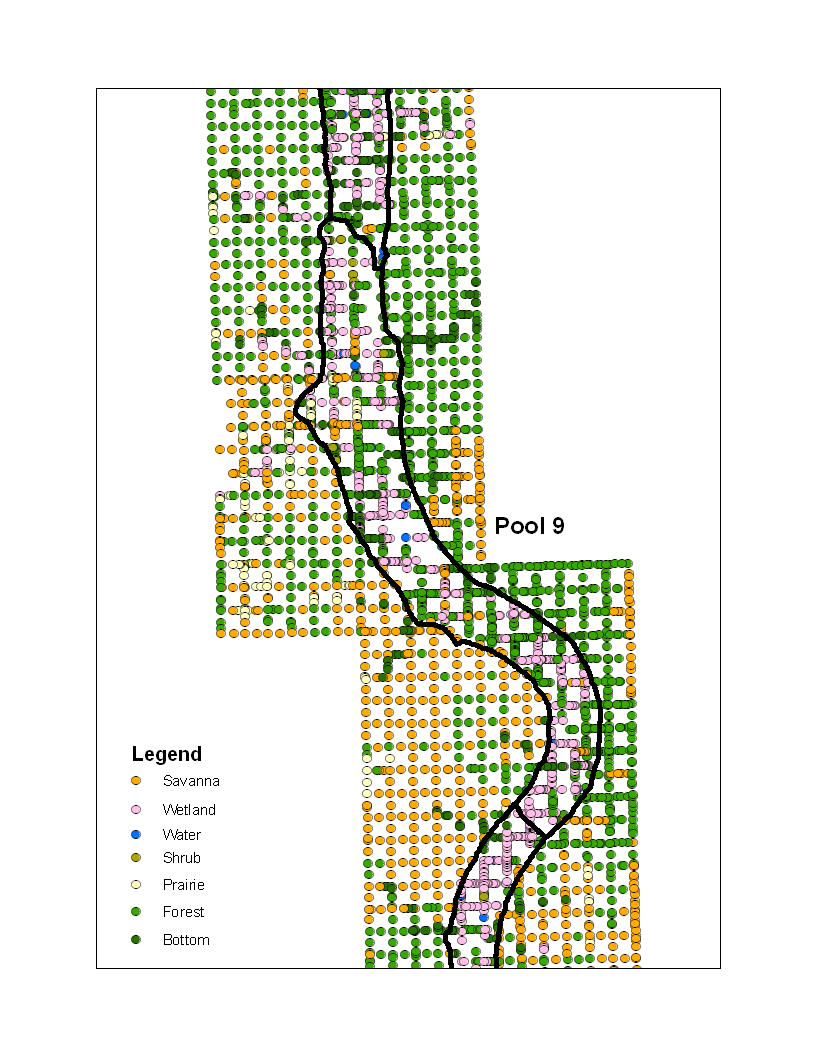 Pool_9_1840s.png – The Public Land Survey was an effort by the U.S. government to survey the mostly unsettled western territories in order to sell land to the westward-expanding population of the United States, beginning in the late 18th century. The survey of the area covered by this project took place between 1806 and 1857. Government Land Office (GLO) surveyors systematically documented land cover and tree species as they established the township and range system. The surveys provide a valuable source of landscape scale information that serve as a baseline reference for documenting change over the last 200 years. The Nature Conservancy (Paul West, The Nature Conservancy, Madison, Wisconsin) has compiled an extraordinary data set of map quadrangles for the entire river valley and adjacent uplands. Many land cover attributes were condensed to the general types: Savanna, Wetland, Water, Shrub, Prairie, Forest, Bottom (see GLO_Ecotype_crosswalk.xls). The dataset is also attributed with tree species for more intensive forestry analysis. This image depicts land cover ca. 1840 in Pool 9. Data analysis is in progress, questions can be addressed to Chuck Theiling, USACE Rock Island District, Rock Island, Illinois (charles.h.theiling@usace.army.mil).
4. Habitat/ 2. Presettlement Land Cover Summary
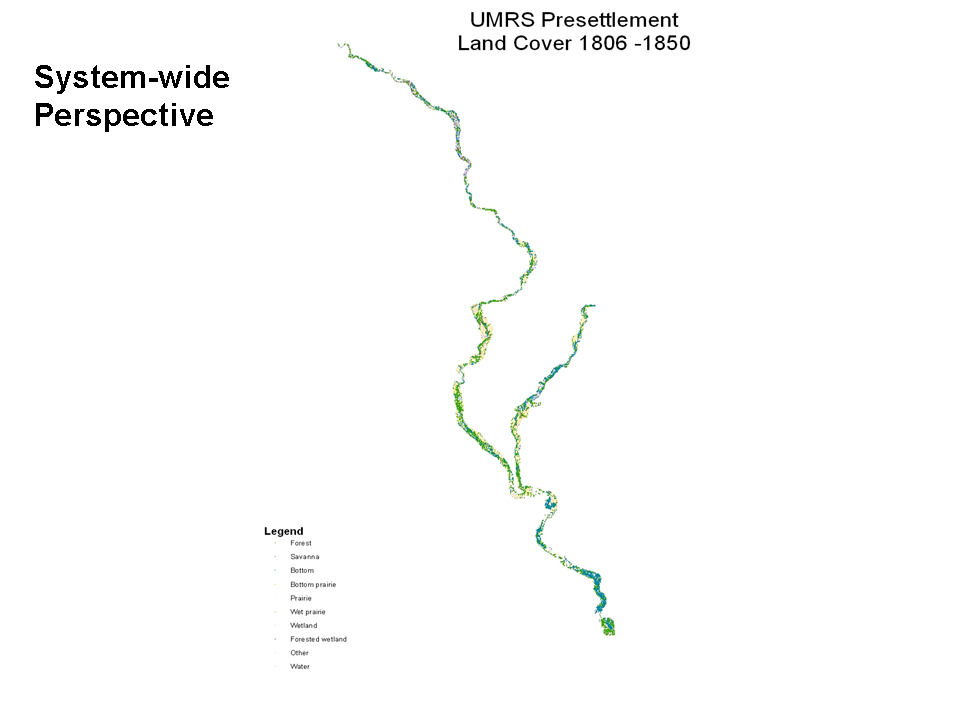 UMRS_1840_LandCvr_Map.PNG - The Public Land Survey was an effort by the U.S. government to survey the mostly unsettled western territories in order to sell land to the westward-expanding population of the United States, beginning in the late 18th century. The survey of the area covered by this project took place between 1806 and 1857. Government Land Office (GLO) surveyors systematically documented land cover and tree species as they established the township and range system. The surveys provide a valuable source of landscape scale information that can serve as a baseline reference for documenting change over the last 200 years. The Nature Conservancy (Paul West, The Nature Conservancy, Madison, Wisconsin) has compiled an extraordinary data set of map quadrangles for the entire river valley and adjacent uplands. Many land cover attributes were condensed to the general types: Savanna, Wetland, Water, Shrub, Prairie, Forest, Bottom (see GLO_Ecotype_crosswalk.xls). The dataset is also attributed with tree species for more intensive forestry analysis. This image depicts land cover ca. 1800 - 1850 throughout the UMRS. Data analysis is in progress, questions can be addressed to Chuck Theiling, USACE Rock Island District, Rock Island, Illinois (charles.h.theiling@usace.army.mil).
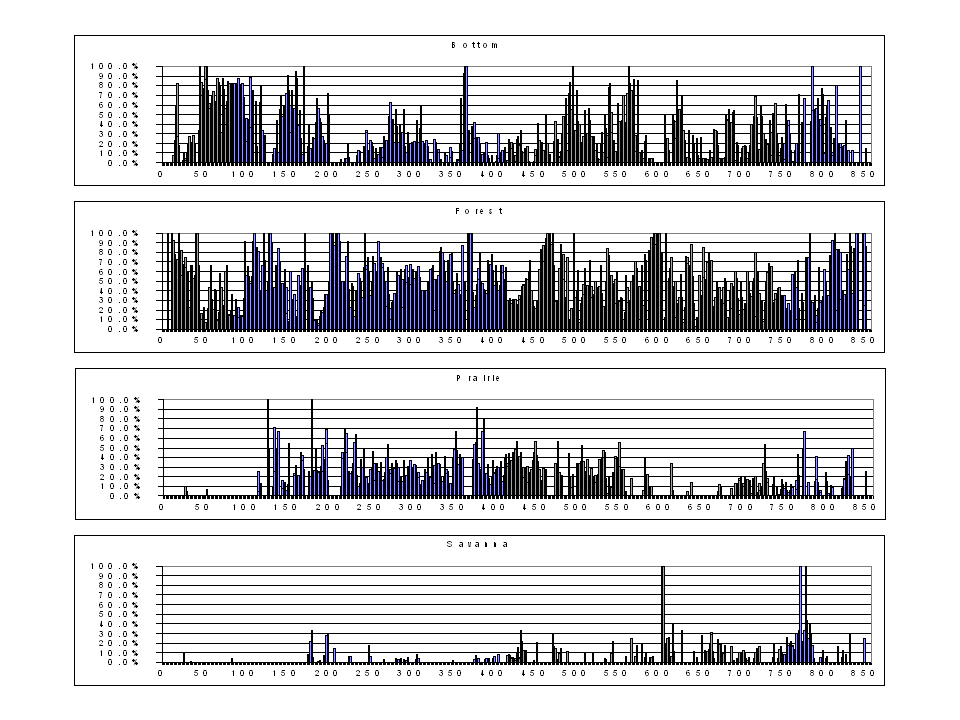 UMRS_1840_LandCvr_proportion_1of3.PNG - The Public Land Survey was an effort by the U.S. government to survey the mostly unsettled western territories in order to sell land to the westward-expanding population of the United States, beginning in the late 18th century. The survey of the area covered by this project took place between 1806 and 1857. Government Land Office (GLO) surveyors systematically documented land cover and tree species as they established the township and range system. The surveys provide a valuable source of landscape scale information that can serve as a baseline reference for documenting change over the last 200 years. The Nature Conservancy (Paul West, The Nature Conservancy, Madison, Wisconsin) has compiled an extraordinary data set of map quadrangles for the entire river valley and adjacent uplands. Many land cover attributes were condensed to the general types: Savanna, Wetland, Water, Shrub, Prairie, Forest, Bottom (see GLO_Ecotype_crosswalk.xls). The dataset is also attributed with tree species for more intensive forestry analysis. This image depicts the proportion of Bottom, Forest, Prairie, and Savanna land cover classes at each river mile in the UMRS ca. 1800 - 1850. Data analysis is in progress, questions can be addressed to Chuck Theiling, USACE Rock Island District, Rock Island, Illinois (charles.h.theiling@usace.army.mil).
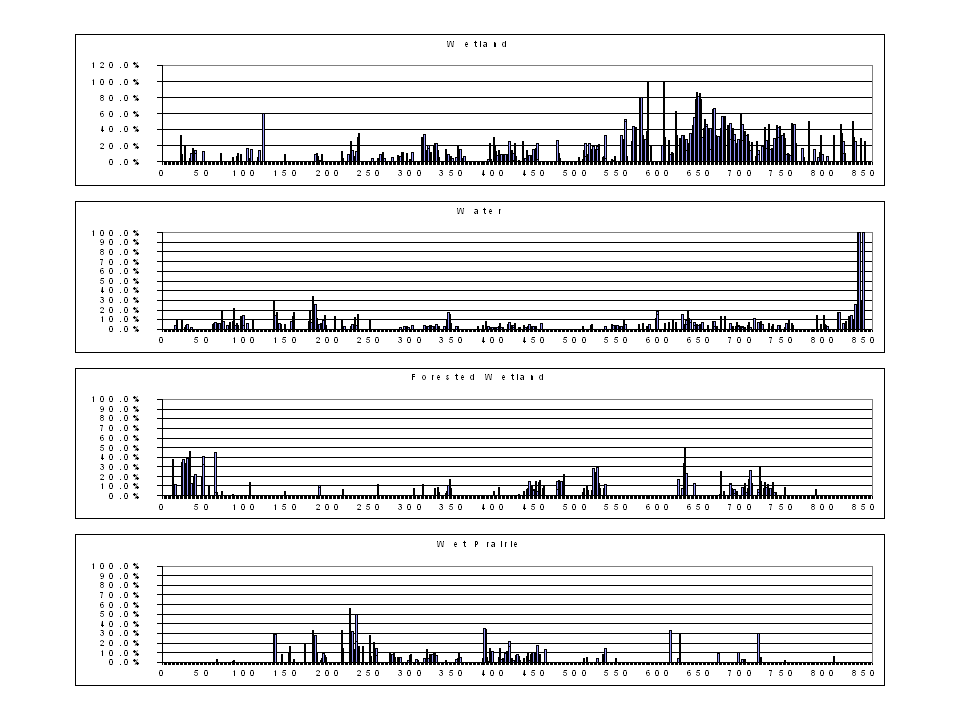 UMRS_1840_LandCvr_proportion_2of3.PNG - The Public Land Survey was an effort by the U.S. government to survey the mostly unsettled western territories in order to sell land to the westward-expanding population of the United States, beginning in the late 18th century. The survey of the area covered by this project took place between 1806 and 1857. Government Land Office (GLO) surveyors systematically documented land cover and tree species as they established the township and range system. The surveys provide a valuable source of landscape scale information that can serve as a baseline reference for documenting change over the last 200 years. The Nature Conservancy (Paul West, The Nature Conservancy, Madison, Wisconsin) has compiled an extraordinary data set of map quadrangles for the entire river valley and adjacent uplands. Many land cover attributes were condensed to the general types: Savanna, Wetland, Water, Shrub, Prairie, Forest, Bottom (see GLO_Ecotype_crosswalk.xls). The dataset is also attributed with tree species for more intensive forestry analysis. This image depicts the proportion of Wetland, Water, Wet Prairie, and Forested Wetland land cover classes at each river mile in the UMRS ca. 1800 - 1850. Data analysis is in progress, questions can be addressed to Chuck Theiling, USACE Rock Island District, Rock Island, Illinois (charles.h.theiling@usace.army.mil).
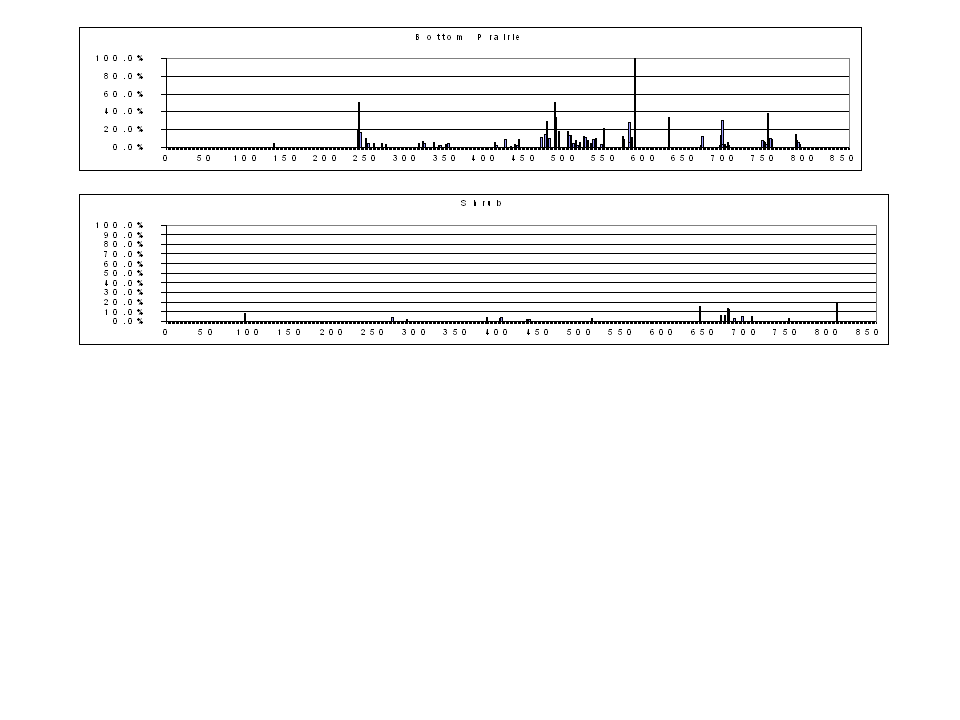 UMRS_1840_LandCvr_proportion_3of3.PNG - The Public Land Survey was an effort by the U.S. government to survey the mostly unsettled western territories in order to sell land to the westward-expanding population of the United States, beginning in the late 18th century. The survey of the area covered by this project took place between 1806 and 1857. Government Land Office (GLO) surveyors systematically documented land cover and tree species as they established the township and range system. The surveys provide a valuable source of landscape scale information that can serve as a baseline reference for documenting change over the last 200 years. The Nature Conservancy (Paul West, The Nature Conservancy, Madison, Wisconsin) has compiled an extraordinary data set of map quadrangles for the entire river valley and adjacent uplands. Many land cover attributes were condensed to the general types: Savanna, Wetland, Water, Shrub, Prairie, Forest, Bottom (see GLO_Ecotype_crosswalk.xls). The dataset is also attributed with tree species for more intensive forestry analysis. This image depicts the proportion of Shrub and Bottom Prairie land cover classes at each river mile in the UMRS ca. 1800 - 1850. Data analysis is in progress, questions can be addressed to Chuck Theiling, USACE Rock Island District, Rock Island, Illinois (charles.h.theiling@usace.army.mil).
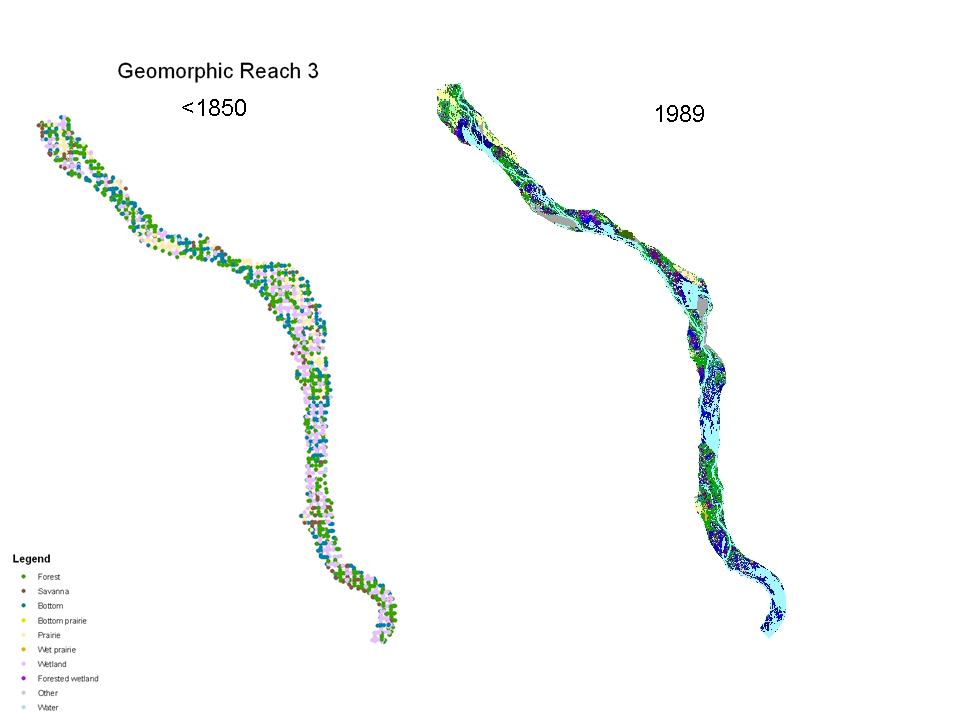 Rch3_1840&1989_LandCvr_Map.PNG - The Public Land Survey was an effort by the U.S. government to survey the mostly unsettled western territories in order to sell land to the westward-expanding population of the United States, beginning in the late 18th century. The survey of the area covered by this project took place between 1806 and 1857. Government Land Office (GLO) surveyors systematically documented land cover and tree species as they established the township and range system. The surveys provide a valuable source of landscape scale information that can serve as a baseline reference for documenting change over the last 200 years. The Nature Conservancy (Paul West, The Nature Conservancy, Madison, Wisconsin) has compiled an extraordinary data set of map quadrangles for the entire river valley and adjacent uplands. Many land cover attributes were condensed to the general types: Savanna, Wetland, Water, Shrub, Prairie, Forest, Bottom (see GLO_Ecotype_crosswalk.xls). The dataset is also attributed with tree species for more intensive forestry analysis. This image depicts the land cover classes in Geomorphic Reach 3 ca. 1840 and 1989. Data analysis is in progress, questions can be addressed to Chuck Theiling, USACE Rock Island District, Rock Island, Illinois (charles.h.theiling@usace.army.mil).
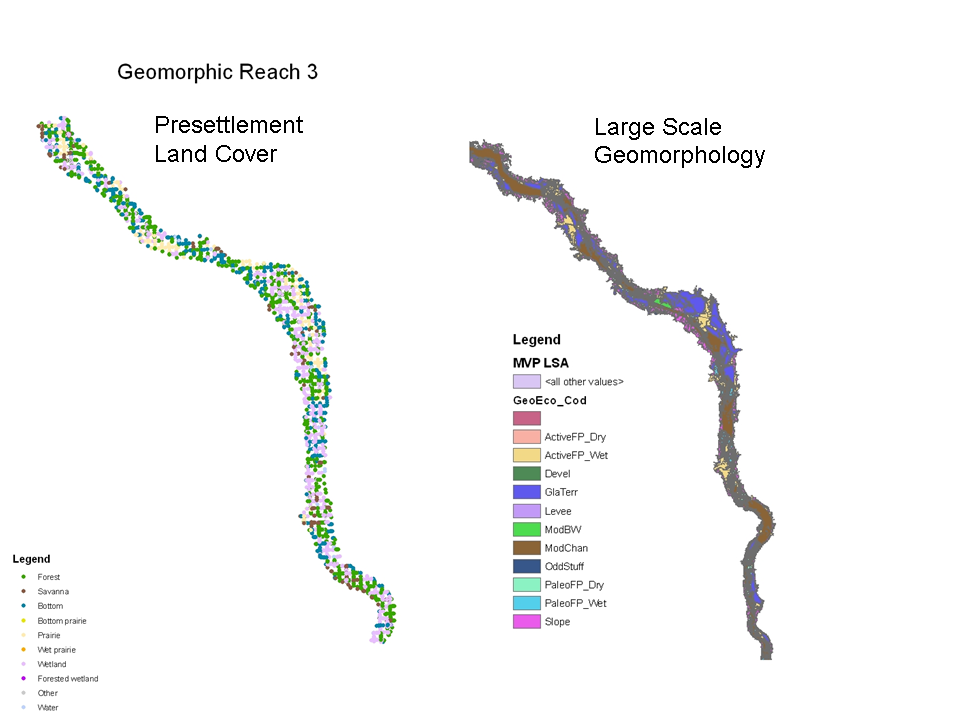 Rch3_Geomorphology_&_LandCvr_Map.PNG - The Public Land Survey was an effort by the U.S. government to survey the mostly unsettled western territories in order to sell land to the westward-expanding population of the United States, beginning in the late 18th century. The survey of the area covered by this project took place between 1806 and 1857. Government Land Office (GLO) surveyors systematically documented land cover and tree species as they established the township and range system. The surveys provide a valuable source of landscape scale information that can serve as a baseline reference for documenting change over the last 200 years. The Nature Conservancy (Paul West, The Nature Conservancy, Madison, Wisconsin) has compiled an extraordinary data set of map quadrangles for the entire river valley and adjacent uplands. Many land cover attributes were condensed to the general types: Savanna, Wetland, Water, Shrub, Prairie, Forest, Bottom (see GLO_Ecotype_crosswalk.xls). The dataset is also attributed with tree species for more intensive forestry analysis. This image depicts the land cover classes ca. 1840 and large scale geomorphic features that strongly influence land cover. Data analysis is in progress, questions can be addressed to Chuck Theiling, USACE Rock Island District, Rock Island, Illinois (charles.h.theiling@usace.army.mil).
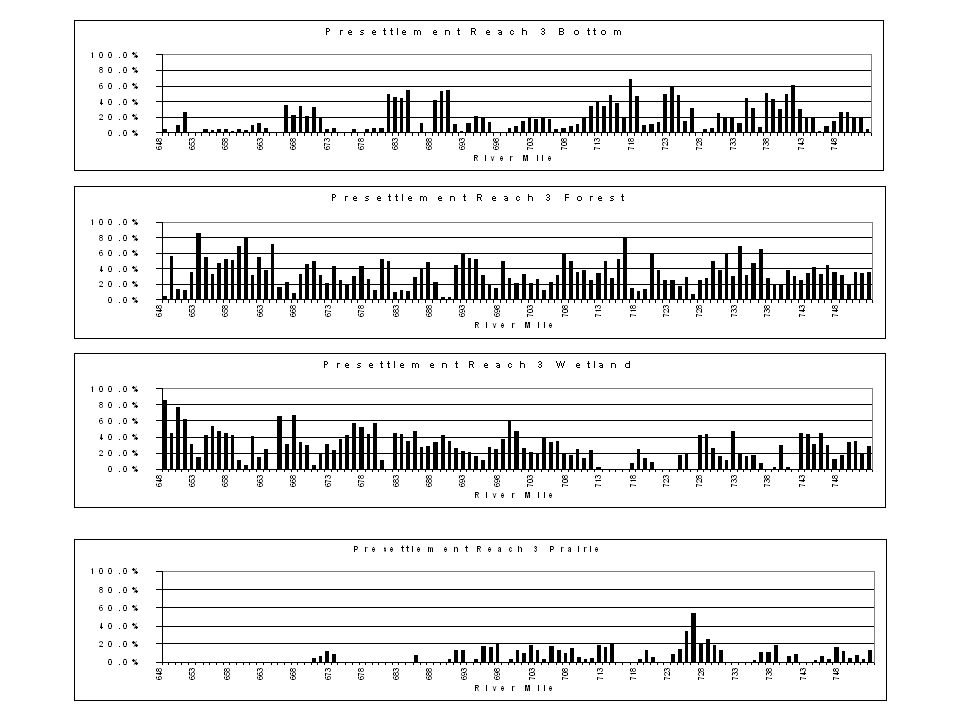 Rch3_1840_LandCvr_proportion_1of3.PNG - The Public Land Survey was an effort by the U.S. government to survey the mostly unsettled western territories in order to sell land to the westward-expanding population of the United States, beginning in the late 18th century. The survey of the area covered by this project took place between 1806 and 1857. Government Land Office (GLO) surveyors systematically documented land cover and tree species as they established the township and range system. The surveys provide a valuable source of landscape scale information that can serve as a baseline reference for documenting change over the last 200 years. The Nature Conservancy (Paul West, The Nature Conservancy, Madison, Wisconsin) has compiled an extraordinary data set of map quadrangles for the entire river valley and adjacent uplands. Many land cover attributes were condensed to the general types: Savanna, Wetland, Water, Shrub, Prairie, Forest, Bottom (see GLO_Ecotype_crosswalk.xls). The dataset is also attributed with tree species for more intensive forestry analysis. This image depicts the proportion of Bottom, Forest, Wetlan, and Prairie land cover classes at each river mile in the UMRS ca. 1800 - 1850. This image depicts the proportion of total floodplain area in each land cover class in Geomorphic Reach 3 ca. 1840. Data analysis is in progress, questions can be addressed to Chuck Theiling, USACE Rock Island District, Rock Island, Illinois (charles.h.theiling@usace.army.mil).
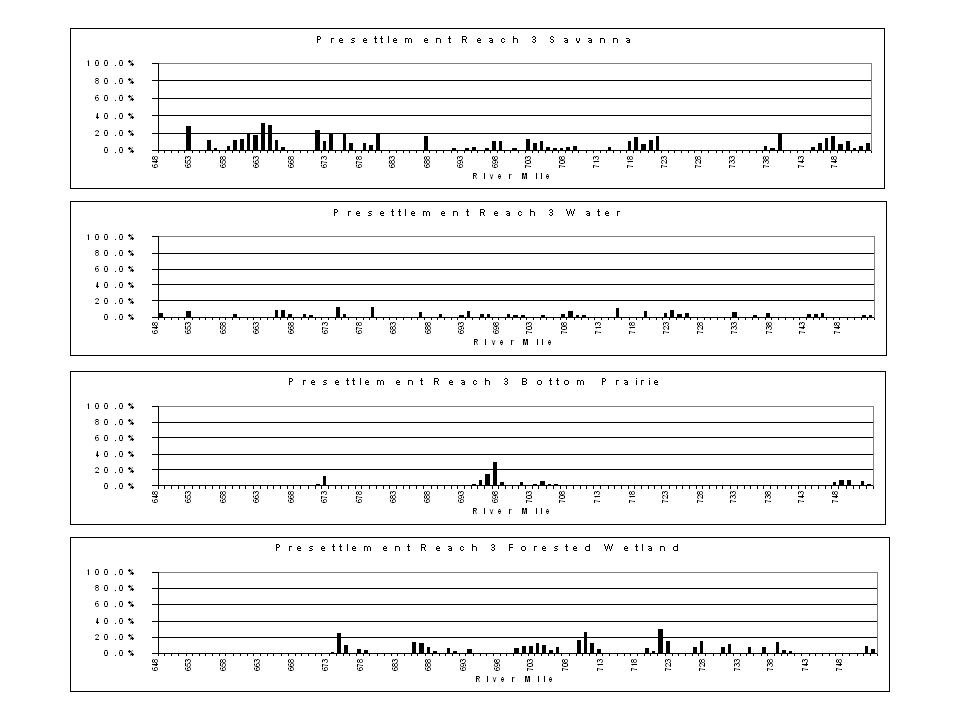 Rch3_1840_LandCvr_proportion_2of3.PNG - The Public Land Survey was an effort by the U.S. government to survey the mostly unsettled western territories in order to sell land to the westward-expanding population of the United States, beginning in the late 18th century. The survey of the area covered by this project took place between 1806 and 1857. Government Land Office (GLO) surveyors systematically documented land cover and tree species as they established the township and range system. The surveys provide a valuable source of landscape scale information that can serve as a baseline reference for documenting change over the last 200 years. The Nature Conservancy (Paul West, The Nature Conservancy, Madison, Wisconsin) has compiled an extraordinary data set of map quadrangles for the entire river valley and adjacent uplands. Many land cover attributes were condensed to the general types: Savanna, Wetland, Water, Shrub, Prairie, Forest, Bottom (see GLO_Ecotype_crosswalk.xls). The dataset is also attributed with tree species for more intensive forestry analysis. This image depicts the proportion of Savanna, Water, Bottom Prairie, and Forested Wetland land cover classes at each river mile in the UMRS ca. 1800 - 1850. This image depicts the proportion of total floodplain area in each land cover class in Geomorphic Reach 3 ca. 1840. Data analysis is in progress, questions can be addressed to Chuck Theiling, USACE Rock Island District, Rock Island, Illinois (charles.h.theiling@usace.army.mil).
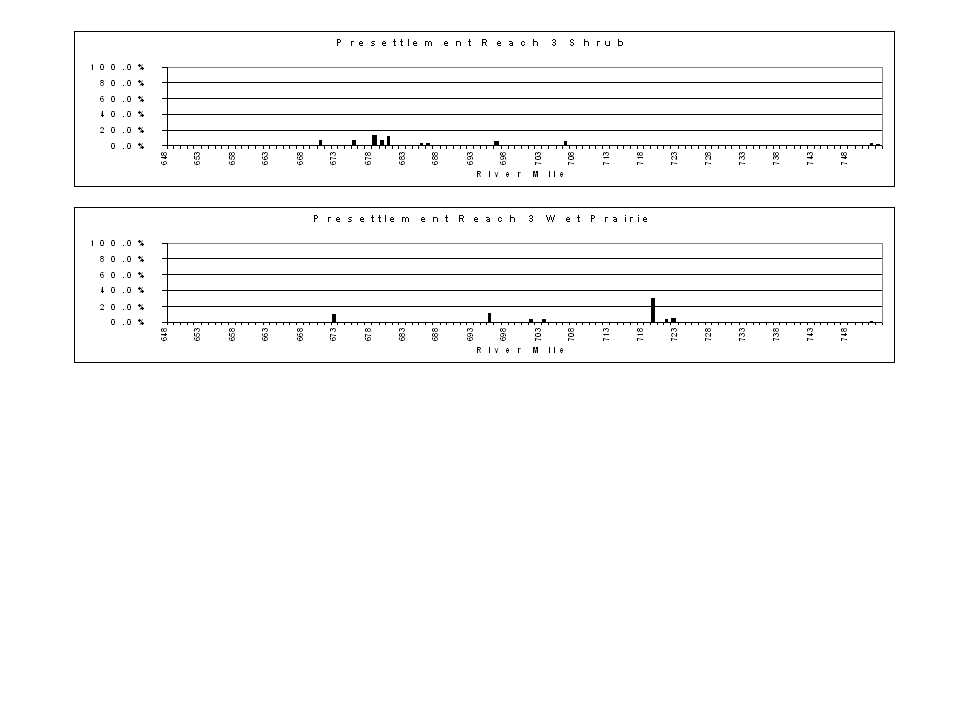 Rch3_1840_LandCvr_proportion_3of3.PNG - The Public Land Survey was an effort by the U.S. government to survey the mostly unsettled western territories in order to sell land to the westward-expanding population of the United States, beginning in the late 18th century. The survey of the area covered by this project took place between 1806 and 1857. Government Land Office (GLO) surveyors systematically documented land cover and tree species as they established the township and range system. The surveys provide a valuable source of landscape scale information that can serve as a baseline reference for documenting change over the last 200 years. The Nature Conservancy (Paul West, The Nature Conservancy, Madison, Wisconsin) has compiled an extraordinary data set of map quadrangles for the entire river valley and adjacent uplands. Many land cover attributes were condensed to the general types: Savanna, Wetland, Water, Shrub, Prairie, Forest, Bottom (see GLO_Ecotype_crosswalk.xls). The dataset is also attributed with tree species for more intensive forestry analysis. This image depicts the proportion of Shrub and Wet Prairie land cover classes at each river mile in the UMRS ca. 1800 - 1850. This image depicts the proportion of total floodplain area in each land cover class in Geomorphic Reach 3 ca. 1840. Data analysis is in progress, questions can be addressed to Chuck Theiling, USACE Rock Island District, Rock Island, Illinois (charles.h.theiling@usace.army.mil).
4. Habitat/3. Contemporary Land Cover Maps
Land Cover mapping provides information on large-scale physical and biotic habitats. Land cover maps generally illustrate large scale geomorphic features like channels, lakes, and islands as well as plant communities like forests, prairies, and wetlands. The Environmental Management Program – Long Term Resource Monitoring Program has been at the fore-front of developing, delivering, and applying these data system-wide.
Land cover data can be obtained at: http://www.umesc.usgs.gov/data_library/land_cover_use/land_cover_use_data.html
Static maps and data for the entire river can be obtained at: http://www.umesc.usgs.gov/data_library/land_cover_use/interactive_index.html
Interactive maps can be accessed at: http://umesc-gisdb03.er.usgs.gov/landcover/viewer.aspx
4. Habitat/4. Contemporary Land Cover Summary
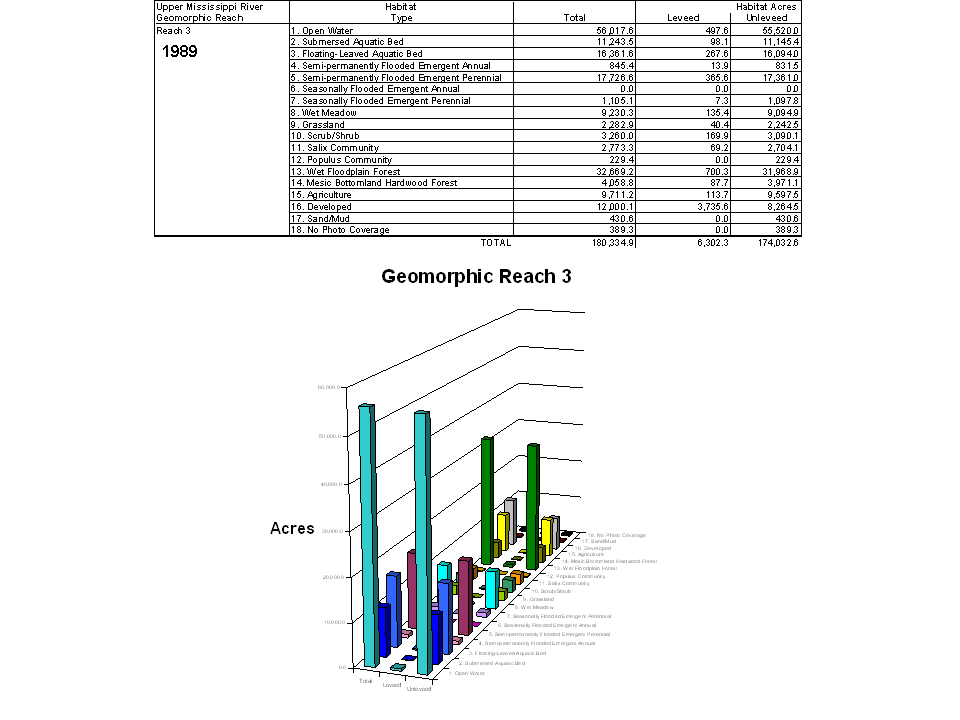 Rch3_HNA_LandCvr_1989.PNG - The Upper Mississippi River System Habitat Needs Assessment was a comprehensive analysis of historic and existing land cover, the natural and human processes responsible for habitat condition, and of natural resource manager’s desired future condition of the river. The Land Cover summary and other results of the Habitat Needs Assessment were reported for system, reach, and pool scales, they can be obtained at: http://www.umesc.usgs.gov/habitat_needs_assessment/emp_hna.html. This table and bar chart image presents the total area of 18 land cover classes for Geomorphic Reach 3 and also separates the data into leveed and non-leveed areas.
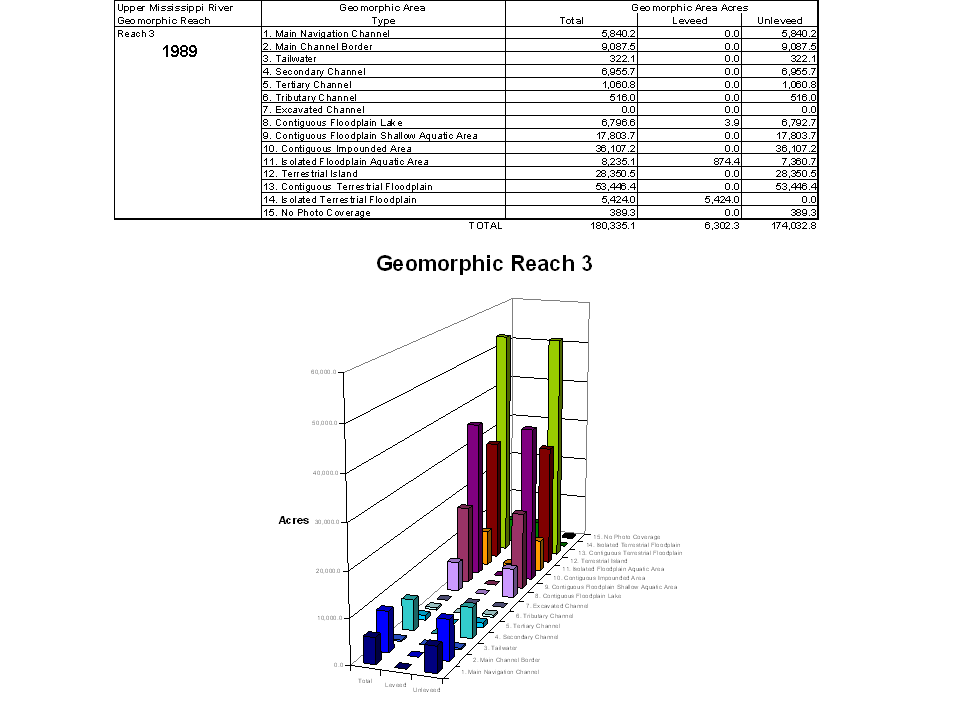 Rch3_HNA_AquaticArea_1989.PNG - The Upper Mississippi River System Habitat Needs Assessment was a comprehensive analysis of historic and existing land cover, the natural and human processes responsible for habitat condition, and of natural resource manager’s desired future condition of the river. The Land Cover summary and other results of the Habitat Needs Assessment were reported for system, reach, and pool scales, they can be obtained at: http://www.umesc.usgs.gov/habitat_needs_assessment/emp_hna.html. This table and bar chart image presents the total area of 15 geomorphic area classes for Geomorphic Reach 3 and also separates the data into leveed and non-leveed areas.
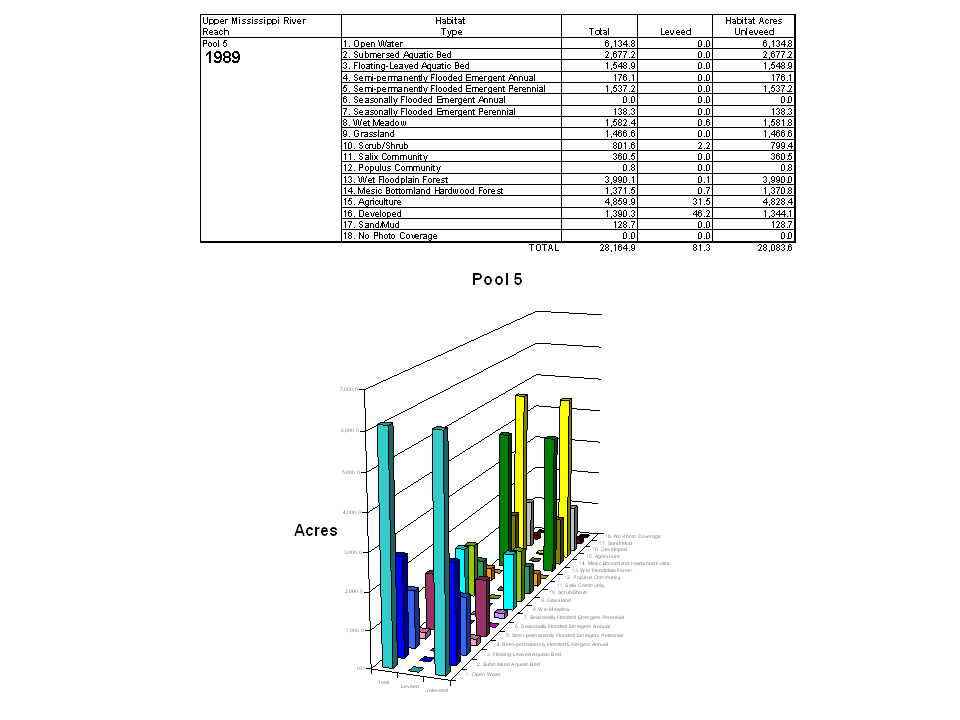 Pool5_HNA_LandCvr_1989.PNG - The Upper Mississippi River System Habitat Needs Assessment was a comprehensive analysis of historic and existing land cover, the natural and human processes responsible for habitat condition, and of natural resource manager’s desired future condition of the river. The Land Cover summary and other results of the Habitat Needs Assessment were reported for system, reach, and pool scales, they can be obtained at: http://www.umesc.usgs.gov/habitat_needs_assessment/emp_hna.html . This table and bar chart image presents the total area of 18 land cover classes for Pool 5 and also separates the data into leveed and non-leveed areas.
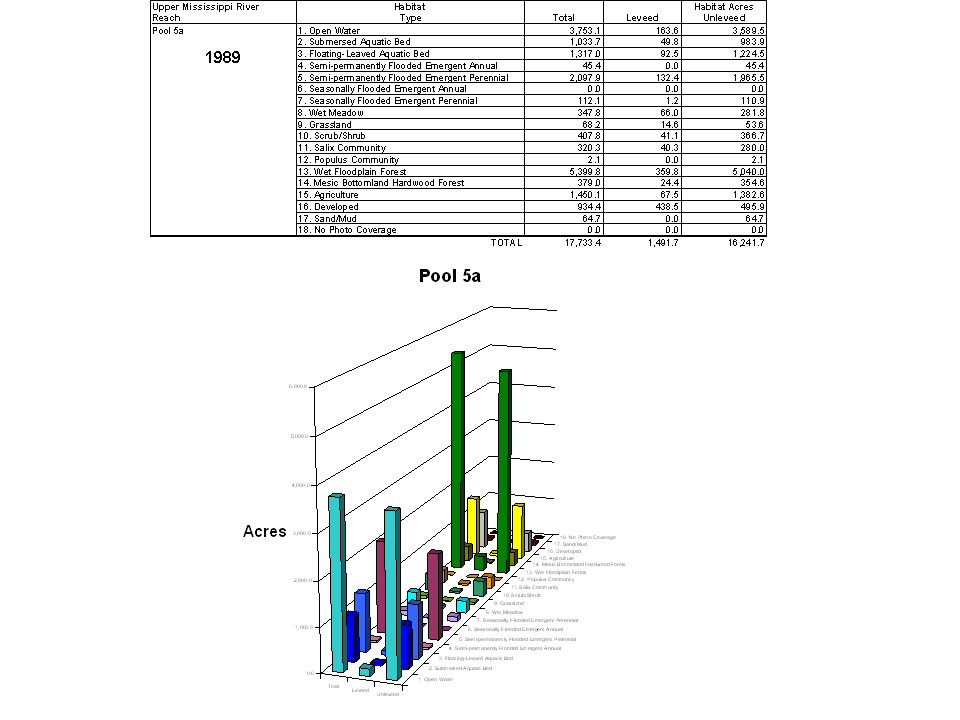 Pool5a_HNA_LandCvr_1989.PNG - The Upper Mississippi River System Habitat Needs Assessment was a comprehensive analysis of historic and existing land cover, the natural and human processes responsible for habitat condition, and of natural resource manager’s desired future condition of the river. The Land Cover summary and other results of the Habitat Needs Assessment were reported for system, reach, and pool scales, they can be obtained at: http://www.umesc.usgs.gov/habitat_needs_assessment/emp_hna.html. This table and bar chart image presents the total area of 18 land cover classes for Pool 5a and also separates the data into leveed and non-leveed areas.
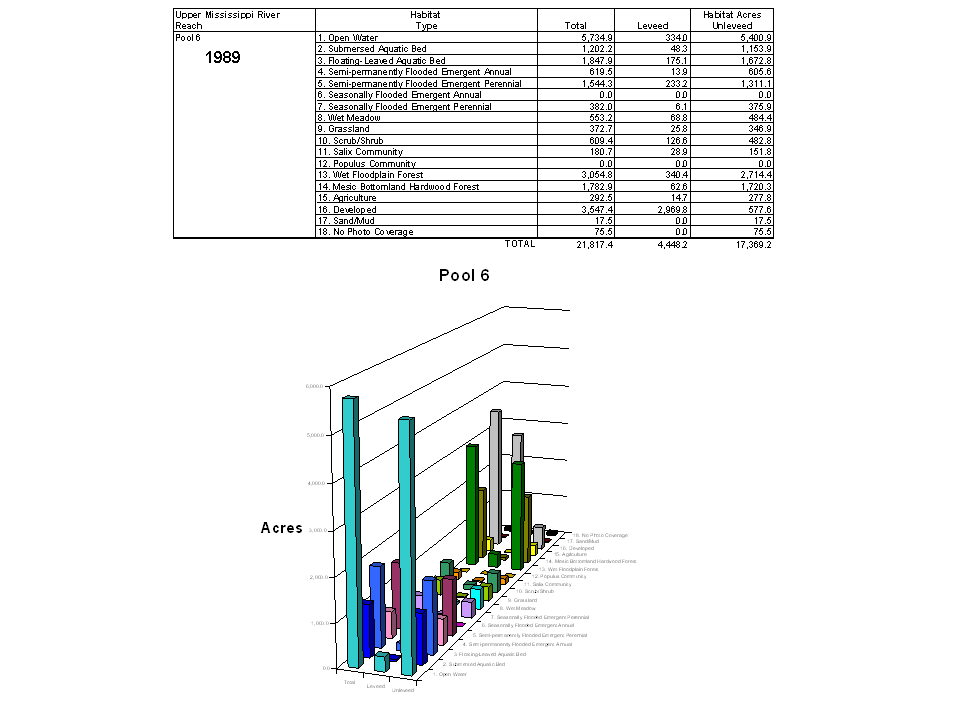 Pool6_HNA_LandCvr_1989.PNG - The Upper Mississippi River System Habitat Needs Assessment was a comprehensive analysis of historic and existing land cover, the natural and human processes responsible for habitat condition, and of natural resource manager’s desired future condition of the river. The Land Cover summary and other results of the Habitat Needs Assessment were reported for system, reach, and pool scales, they can be obtained at: http://www.umesc.usgs.gov/habitat_needs_assessment/emp_hna.html. This table and bar chart image presents the total area of 18 land cover classes for Pool 6 and also separates the data into leveed and non-leveed areas.
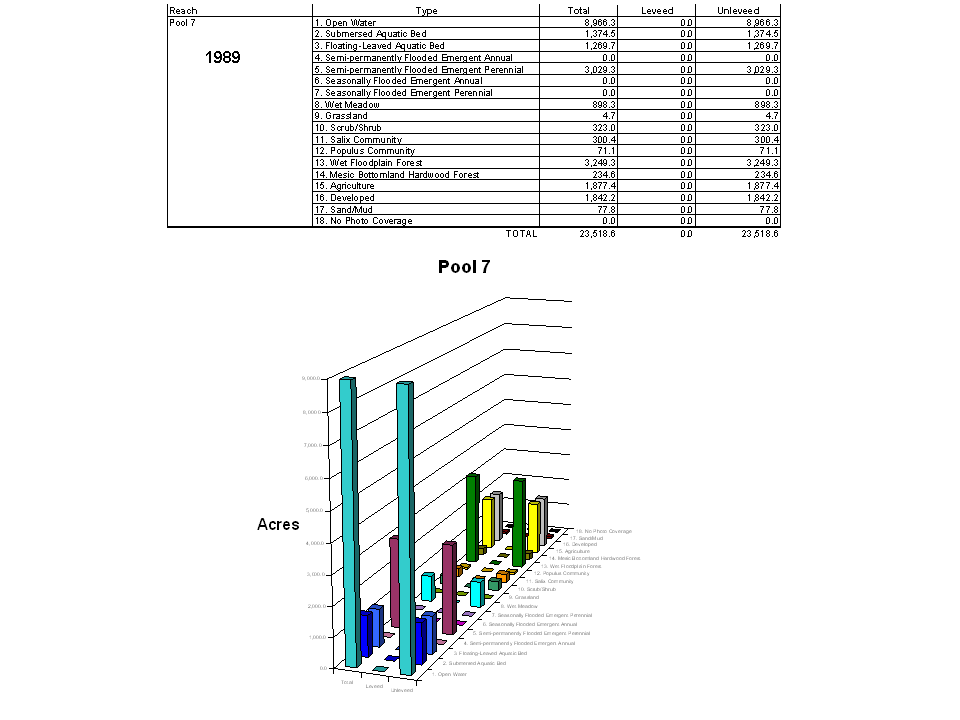 Pool7_HNA_LandCvr_1989.PNG - The Upper Mississippi River System Habitat Needs Assessment was a comprehensive analysis of historic and existing land cover, the natural and human processes responsible for habitat condition, and of natural resource manager’s desired future condition of the river. The Land Cover summary and other results of the Habitat Needs Assessment were reported for system, reach, and pool scales, they can be obtained at: http://www.umesc.usgs.gov/habitat_needs_assessment/emp_hna.html. This table and bar chart image presents the total area of 18 land cover classes for Pool 7 and also separates the data into leveed and non-leveed areas.
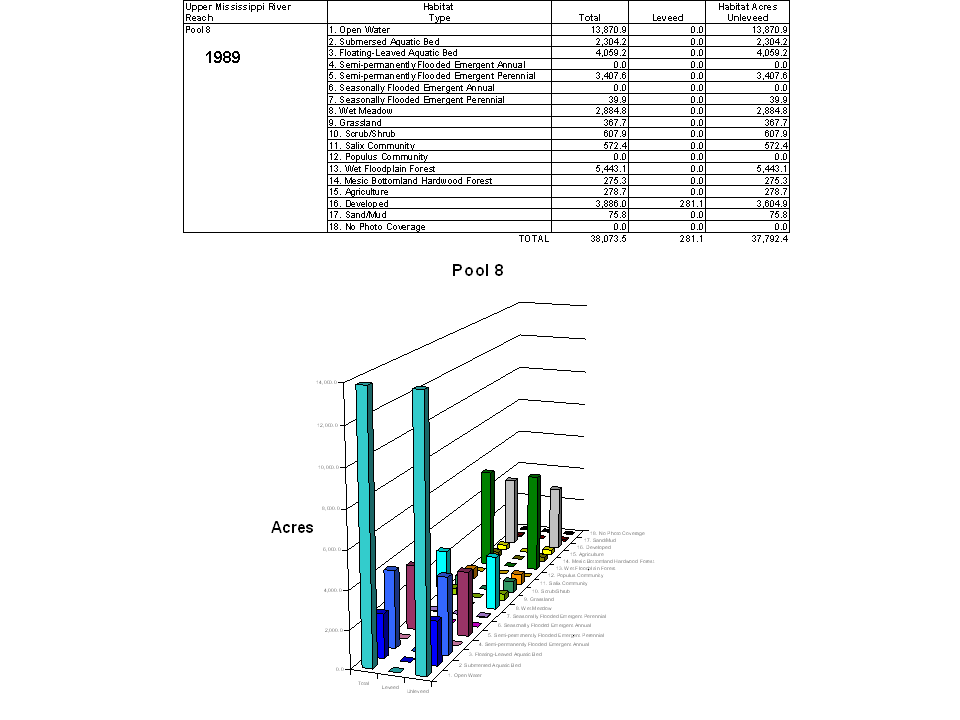 Pool8_HNA_LandCvr_1989.PNG - The Upper Mississippi River System Habitat Needs Assessment was a comprehensive analysis of historic and existing land cover, the natural and human processes responsible for habitat condition, and of natural resource manager’s desired future condition of the river. The Land Cover summary and other results of the Habitat Needs Assessment were reported for system, reach, and pool scales, they can be obtained at: http://www.umesc.usgs.gov/habitat_needs_assessment/emp_hna.html. This table and bar chart image presents the total area of 18 land cover classes for Pool 8 and also separates the data into leveed and non-leveed areas.
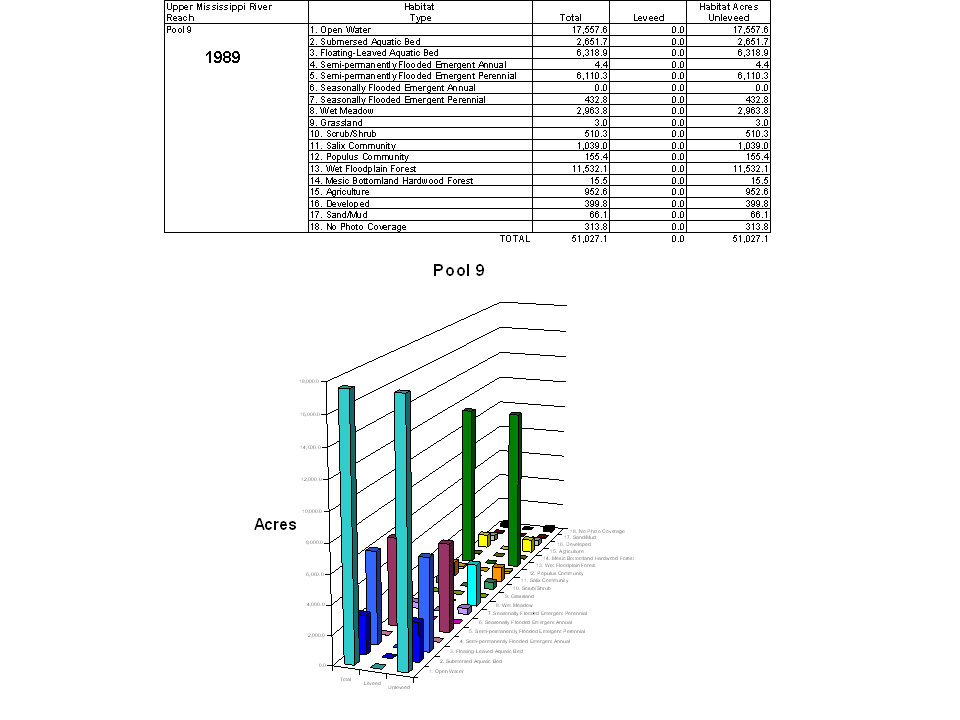 Pool9_HNA_LandCvr_1989.PNG - The Upper Mississippi River System Habitat Needs Assessment was a comprehensive analysis of historic and existing land cover, the natural and human processes responsible for habitat condition, and of natural resource manager’s desired future condition of the river. The Land Cover summary and other results of the Habitat Needs Assessment were reported for system, reach, and pool scales, they can be obtained at: http://www.umesc.usgs.gov/habitat_needs_assessment/emp_hna.html. This table and bar chart image presents the total area of 18 land cover classes for Pool 9 and also separates the data into leveed and non-leveed areas.
5. Biota/
Biological communities on the UMRS are diverse and abundant, though long-term data indicate declines from a former abundance of much greater quality and proportions. Upper Mississippi River System natural resource management professionals have a long history of support for science, monitoring, and management of the system. The Upper Mississippi River Conservation Committee was formed in 1943 to approach Mississippi River management at a system-wide scale. They have several recent reviews of the science and management recommendations for: the rivers in general, water quality, aquatic plants, floodplain forests, freshwater mussels, fishes, and ecosystem restoration (http://www.mississippi-river.com/umrcc/).
U.S. Fish and Wildlife Refuges have all recently complete Comprehensive Conservation Plans to update and review all aspect of refuge management. The objective was to address a broad range of stakeholder and wildlife needs. The three Federal wildlife refuges represent a very large proportion of public land in the UMRS, approximately 300,000 acres or 15 percent of total floodplain area.
Upper Mississippi River National Wildlife and Fish Refuge: Comprehensive Conservation Plan - http://www.fws.gov/midwest/UpperMississippiRiver/Planning.html
Mark Twain National Wildlife Refuges Complex: Comprehensive Conservation Plan - http://www.fws.gov/midwest/Planning/marktwain/index.html
Illinois River National Wildlife and Fish Refuges Complex - http://www.fws.gov/Midwest/Planning/IllinoisRiver/index.html
The Upper Mississippi River System, Environmental Management Program, Long Term Resource Monitoring Program (http://www.umesc.usgs.gov/ltrmp.html) was established in 1986 to establish baseline data and status and trends monitoring for selected ecosystem components and to share the findings with resource managers and policy makers. A summary of initial monitoring results and historic reviews of the UMRS ecosystem were presented in the Ecological Status and Trends of the Upper Mississippi River System – 1998 (http://www.umesc.usgs.gov/reports_publications/status_and_trends.html). The program recently completed their first “baseline” reports documenting sampling results and interpretations over the first full decade of standardized system-wide monitoring. Monitoring components include:
Aquatic Vegetation Reports - http://www.umesc.usgs.gov/reports_publications/ltrmp/vegetation.html
Aquatic Vegetation Data -
http://www.umesc.usgs.gov/data_library/vegetation/vegetation_page.html
Forests - http://www.umesc.usgs.gov/data_library/floodplain_forest/forest_page.html
Macroinvertebrate Reports – http://www.umesc.usgs.gov/reports_publications/ltrmp/macro.html
Macroinvertebrate Data - http://www.umesc.usgs.gov/data_library/macroinvertebrate/invert_page.html
Fish Reports - http://www.umesc.usgs.gov/reports_publications/ltrmp/fish.html
Fish Data - http://www.umesc.usgs.gov/data_library/fisheries/fish_page.html
6. Desired Future/1. Pool Plans/
The Environmental Pool Plans were prepared by the Fish and Wildlife Work Group at the request of the River Resources Forum (Forum). The planning area includes the Mississippi River from the head of navigation at Minneapolis, Minnesota to Lock and Dam No. 10 at Guttenberg, Iowa. Environmental pool plans are maps and descriptions of what river managers and the public have identified as the habitat and features necessary to reverse negative trends in habitat quality and move towards a more sustainable ecosystem. The plans for Pools 2 through 10 are endorsed by the Forum and have become guidelines for future programs and projects for river management. The Forum and its agency partners see general public understanding and acceptance of the plans to be vital for cooperative river management.
Knowledge about river management tools, such as water level management, island stabilization and creation, backwater dredging, and channel modifications, has increased greatly over the last decade. The environmental pool plans will provide the guidelines for applying these tools and others in coordinated river management efforts.
http://www.mvp.usace.army.mil/environment/default.asp?pageid=1265&subpageid=397
6. Desired Future/2. UMR-IWW Navigation Study/
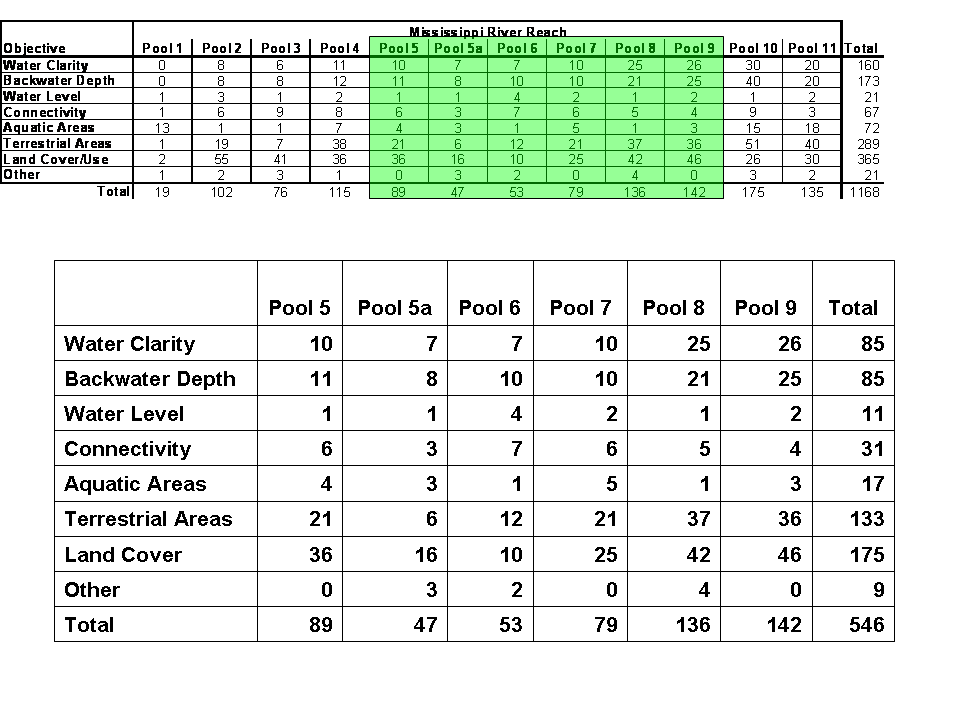 NavStudy_Objective_Summary.PNG – The Upper Mississippi River-Illinois Waterway System Navigation Feasibility Study (Nav. Study) completed numerous investigations into the environmental impacts of commercial navigation, the economic benefits of expanded navigation, and environmental management objectives for the system. Workshops were conducted in four river reaches during 2003 to assess stakeholder objectives for environmental restoration (http://www2.mvr.usace.army.mil/UMRS/NESP/Documents/Env%20Rpt%2050.pdf)). The outcome of the workshops was a set of site-specific environmental restoration objectives that were used to formulate alternative plans for ecosystem restoration evaluation for the Upper Mississippi River-Illinois Waterway System Navigation Feasibility Study that are summarized in this table for the entire St. Paul District and highlighted for Geomorphic Reach 3.
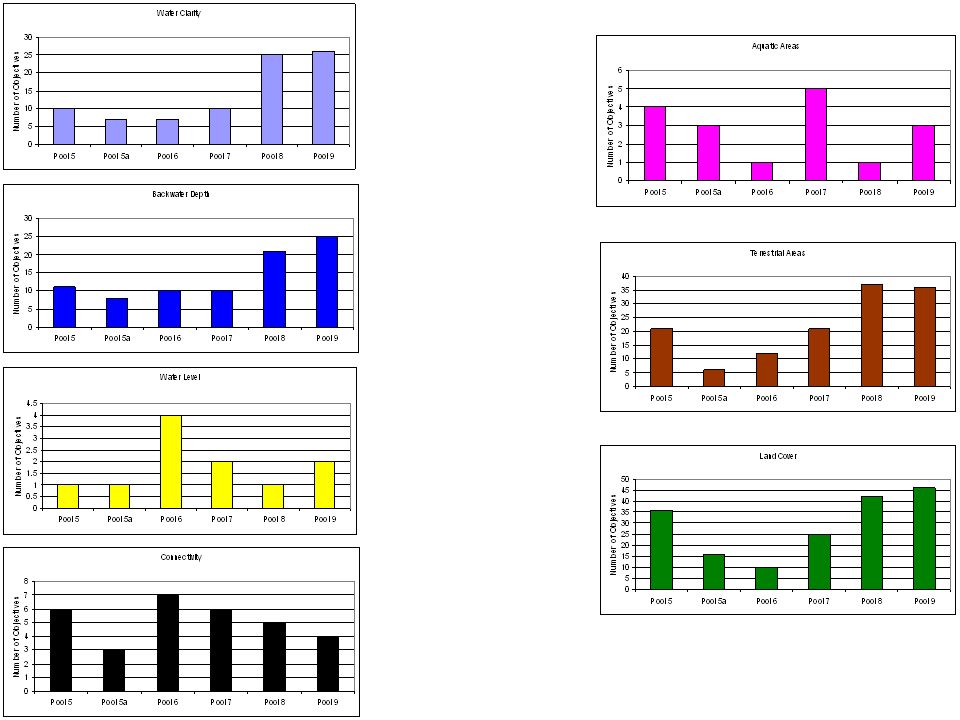 NavStudy_Objectives_Reach3.PNG - The Upper Mississippi River-Illinois Waterway System Navigation Feasibility Study (Nav. Study) completed numerous investigations into the environmental impacts of commercial navigation, the economic benefits of expanded navigation, and environmental management objectives for the system. Workshops were conducted in four river reaches during 2003 to assess stakeholder objectives for environmental restoration (http://www2.mvr.usace.army.mil/UMRS/NESP/Documents/Env%20Rpt%2050.pdf)). The outcome of the workshops was a set of site-specific environmental restoration objectives that were used to formulate alternative plans for ecosystem restoration evaluation for the Upper Mississippi River-Illinois Waterway System Navigation Feasibility Study that are summarized in bar charts for each parameter for Geomorphic Reach 3.
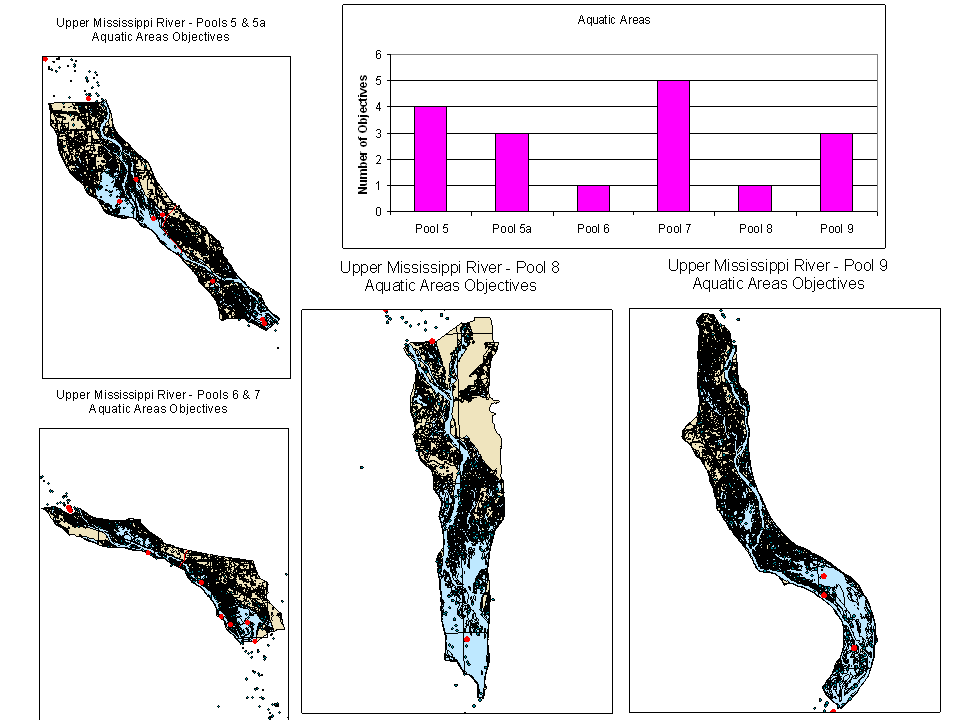 NavStudy_AqArea_Obj_Reach 3.PNG - The Upper Mississippi River-Illinois Waterway System Navigation Feasibility Study (Nav. Study) completed numerous investigations into the environmental impacts of commercial navigation, the economic benefits of expanded navigation, and environmental management objectives for the system. Workshops were conducted in four river reaches during 2003 to assess stakeholder objectives for environmental restoration (http://www2.mvr.usace.army.mil/UMRS/NESP/Documents/Env%20Rpt%2050.pdf)). The outcome of the workshops was a set of site-specific environmental restoration objectives that were used to formulate alternative plans for ecosystem restoration evaluation for the Upper Mississippi River-Illinois Waterway System Navigation Feasibility Study. Objectives for Aquatic Areas are summarized by site-specific dots on pool-scale maps and in bar charts for each Pool in Geomorphic Reach 3.
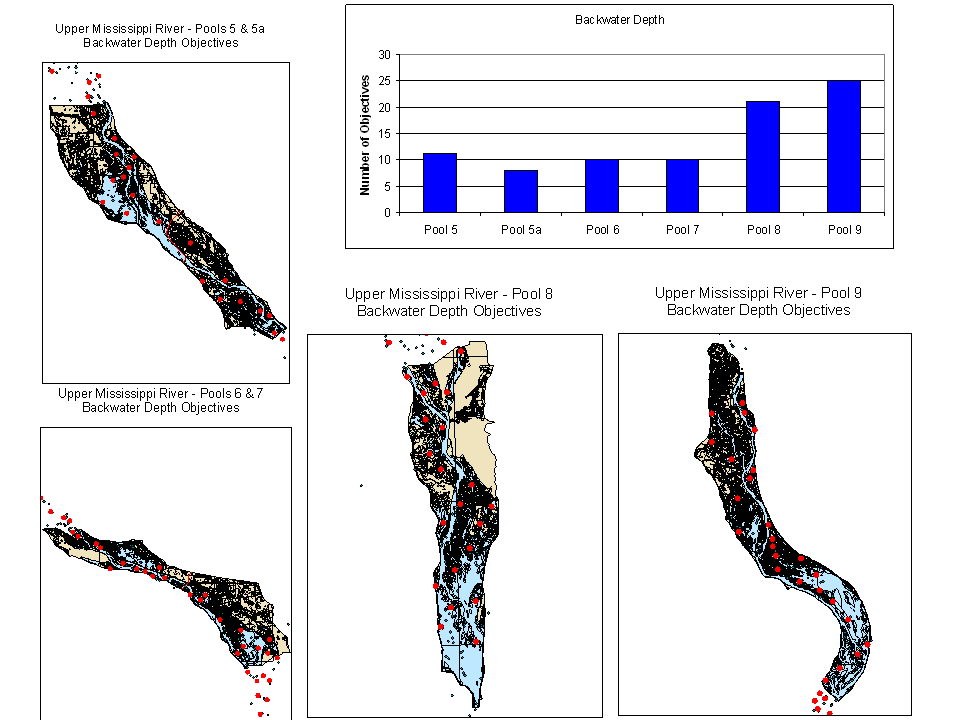 NavStudy_BWDepth_Obj_Reach 3.PNG - The Upper Mississippi River-Illinois Waterway System Navigation Feasibility Study (Nav. Study) completed numerous investigations into the environmental impacts of commercial navigation, the economic benefits of expanded navigation, and environmental management objectives for the system. Workshops were conducted in four river reaches during 2003 to assess stakeholder objectives for environmental restoration (http://www2.mvr.usace.army.mil/UMRS/NESP/Documents/Env%20Rpt%2050.pdf)). The outcome of the workshops was a set of site-specific environmental restoration objectives that were used to formulate alternative plans for ecosystem restoration evaluation for the Upper Mississippi River-Illinois Waterway System Navigation Feasibility Study. Objectives for Backwater Depth are summarized by site-specific dots on pool-scale maps and in bar charts for each Pool in Geomorphic Reach 3.
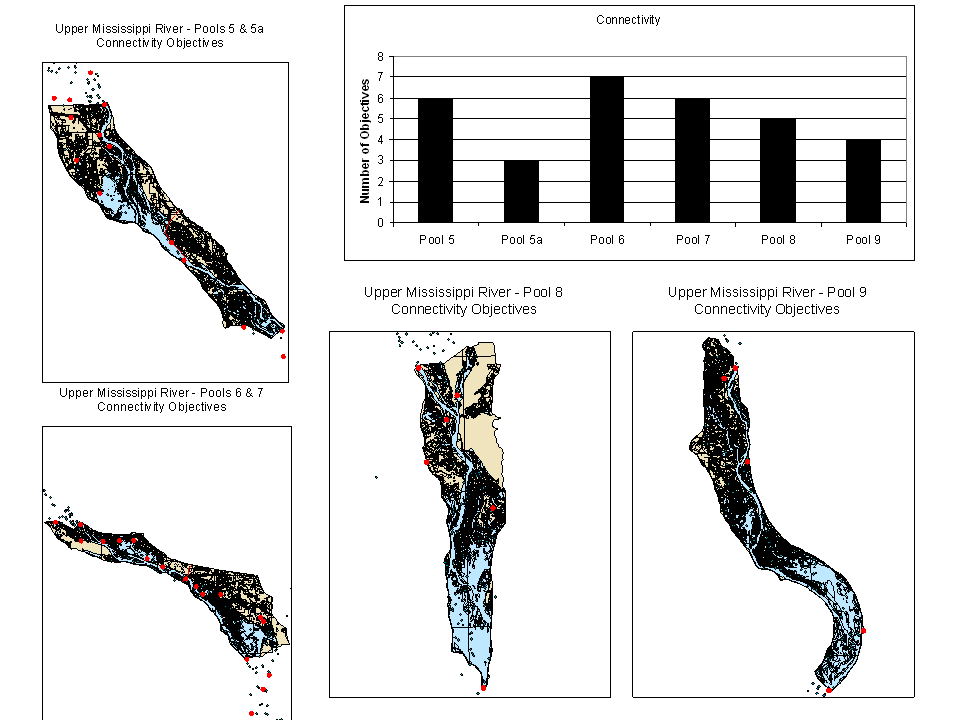 NavStudy_Connectivity_Obj_Reach 3.PNG - The Upper Mississippi River-Illinois Waterway System Navigation Feasibility Study (Nav. Study) completed numerous investigations into the environmental impacts of commercial navigation, the economic benefits of expanded navigation, and environmental management objectives for the system. Workshops were conducted in four river reaches during 2003 to assess stakeholder objectives for environmental restoration (http://www2.mvr.usace.army.mil/UMRS/NESP/Documents/Env%20Rpt%2050.pdf)). The outcome of the workshops was a set of site-specific environmental restoration objectives that were used to formulate alternative plans for ecosystem restoration evaluation for the Upper Mississippi River-Illinois Waterway System Navigation Feasibility Study. Objectives for Connectivity are summarized by site-specific dots on pool-scale maps and in bar charts for each Pool in Geomorphic Reach 3.
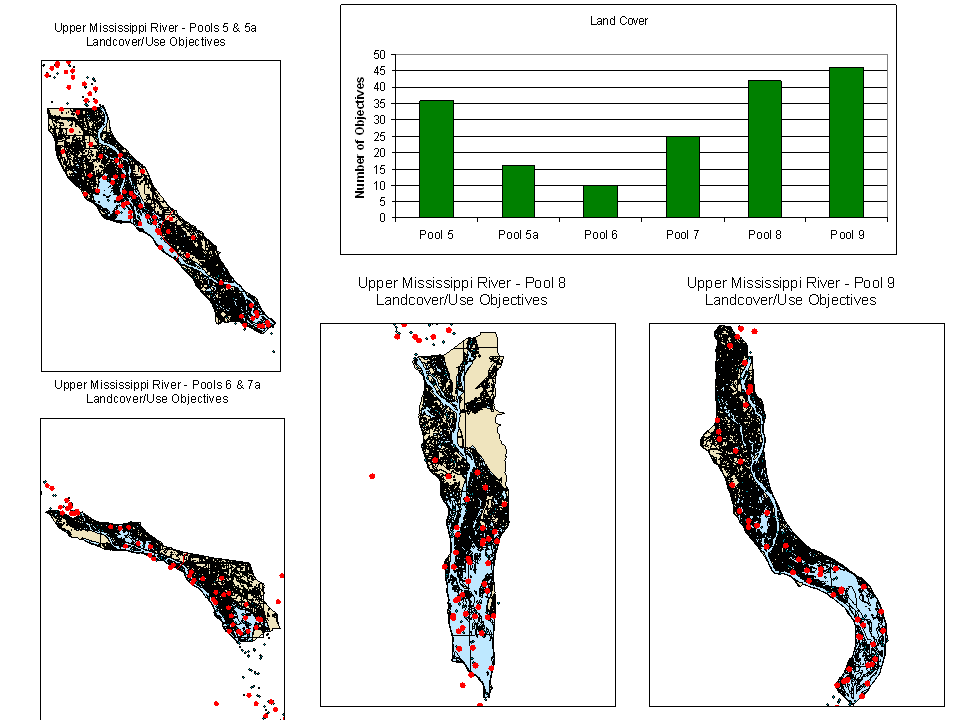 NavStudy_LandCvr_Obj_Reach 3.PNG - The Upper Mississippi River-Illinois Waterway System Navigation Feasibility Study (Nav. Study) completed numerous investigations into the environmental impacts of commercial navigation, the economic benefits of expanded navigation, and environmental management objectives for the system. Workshops were conducted in four river reaches during 2003 to assess stakeholder objectives for environmental restoration (http://www2.mvr.usace.army.mil/UMRS/NESP/Documents/Env%20Rpt%2050.pdf)). The outcome of the workshops was a set of site-specific environmental restoration objectives that were used to formulate alternative plans for ecosystem restoration evaluation for the Upper Mississippi River-Illinois Waterway System Navigation Feasibility Study. Objectives for Land Cover are summarized by site-specific dots on pool-scale maps and in bar charts for each Pool in Geomorphic Reach 3.
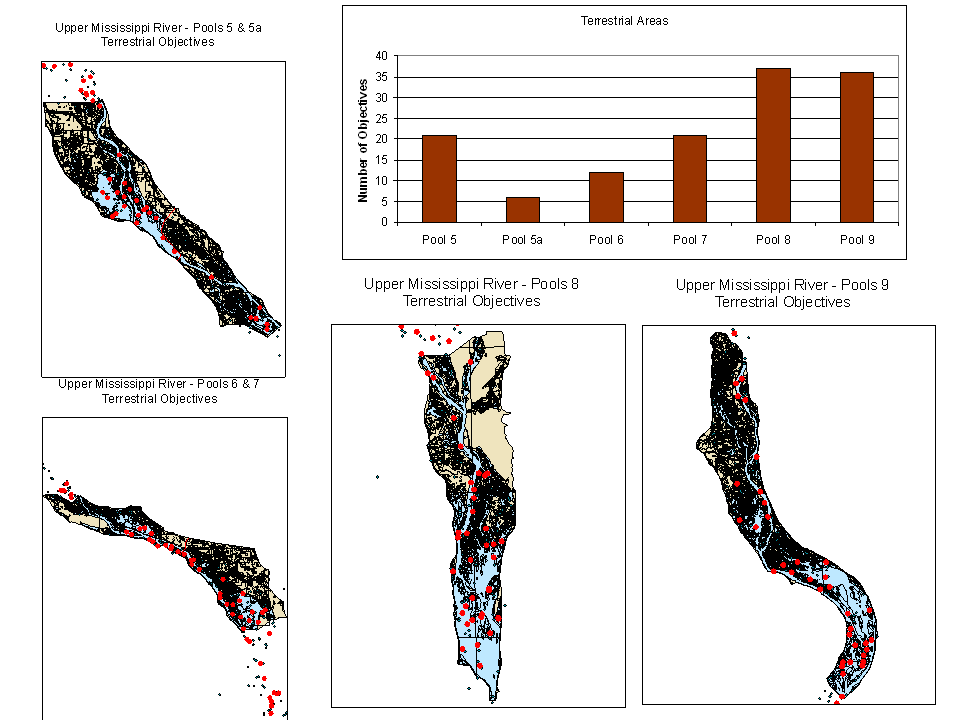 NavStudy_Terrestrial_Obj_Reach 3.PNG - The Upper Mississippi River-Illinois Waterway System Navigation Feasibility Study (Nav. Study) completed numerous investigations into the environmental impacts of commercial navigation, the economic benefits of expanded navigation, and environmental management objectives for the system. Workshops were conducted in four river reaches during 2003 to assess stakeholder objectives for environmental restoration (http://www2.mvr.usace.army.mil/UMRS/NESP/Documents/Env%20Rpt%2050.pdf)). The outcome of the workshops was a set of site-specific environmental restoration objectives that were used to formulate alternative plans for ecosystem restoration evaluation for the Upper Mississippi River-Illinois Waterway System Navigation Feasibility Study. Objectives for Land Cover are summarized by site-specific dots on pool-scale maps and in bar charts for each Pool in Geomorphic Reach 3.
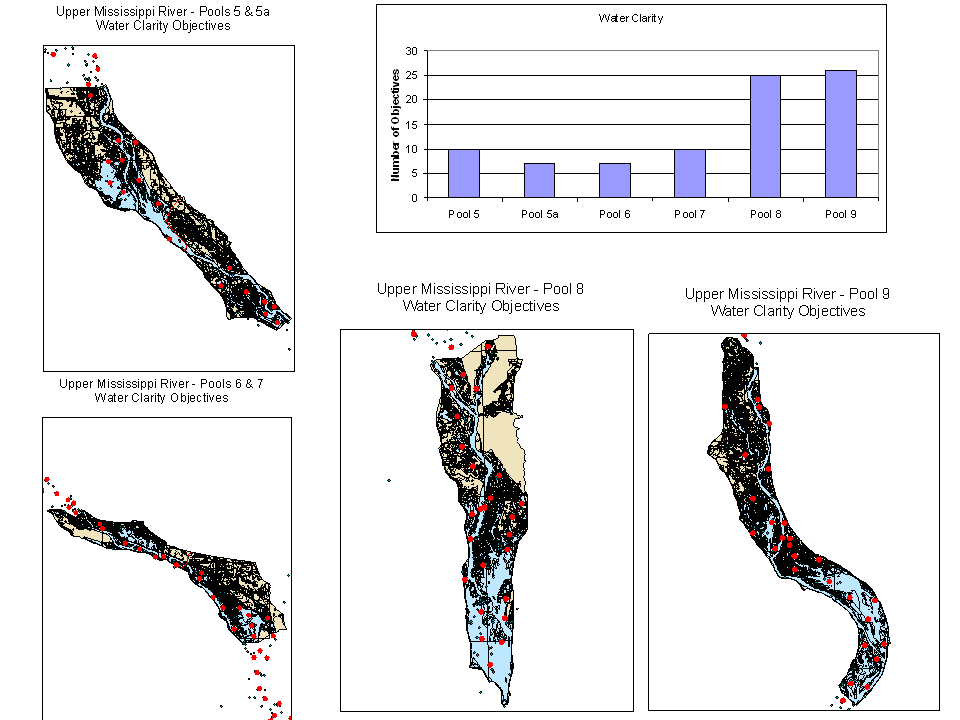 NavStudy_WtrClarity_Obj_Reach 3.PNG - The Upper Mississippi River-Illinois Waterway System Navigation Feasibility Study (Nav. Study) completed numerous investigations into the environmental impacts of commercial navigation, the economic benefits of expanded navigation, and environmental management objectives for the system. Workshops were conducted in four river reaches during 2003 to assess stakeholder objectives for environmental restoration (http://www2.mvr.usace.army.mil/UMRS/NESP/Documents/Env%20Rpt%2050.pdf)). The outcome of the workshops was a set of site-specific environmental restoration objectives that were used to formulate alternative plans for ecosystem restoration evaluation for the Upper Mississippi River-Illinois Waterway System Navigation Feasibility Study. Objectives for Water Clarity are summarized by site-specific dots on pool-scale maps and in bar charts for each Pool in Geomorphic Reach 3.
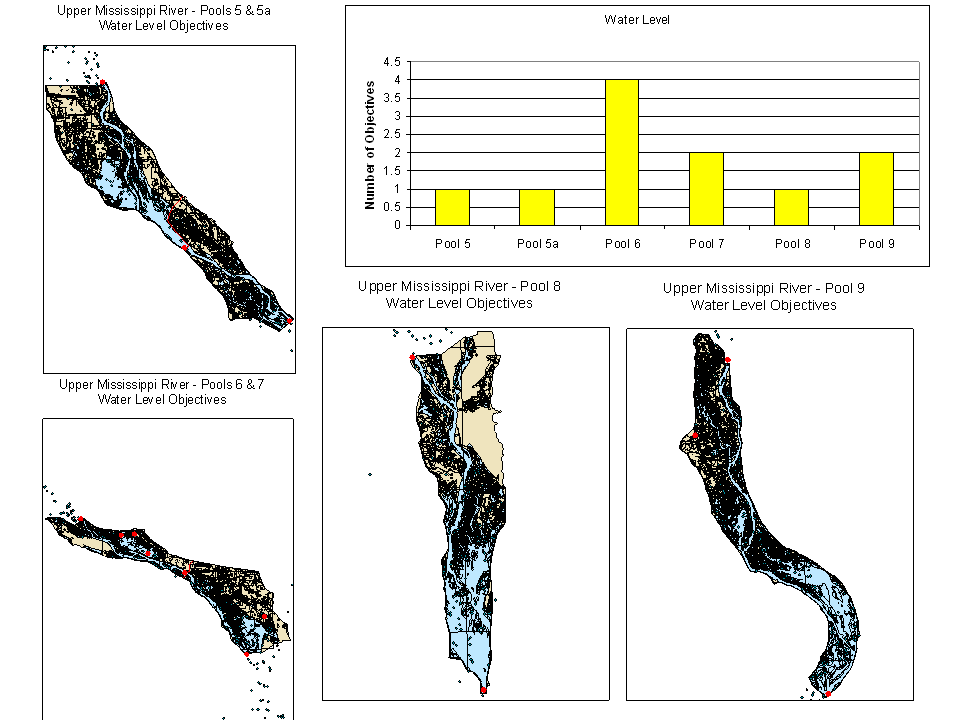 NavStudy_WtrLevel_Obj_Reach 3.PNG - The Upper Mississippi River-Illinois Waterway System Navigation Feasibility Study (Nav. Study) completed numerous investigations into the environmental impacts of commercial navigation, the economic benefits of expanded navigation, and environmental management objectives for the system. Workshops were conducted in four river reaches during 2003 to assess stakeholder objectives for environmental restoration (http://www2.mvr.usace.army.mil/UMRS/NESP/Documents/Env%20Rpt%2050.pdf)). The outcome of the workshops was a set of site-specific environmental restoration objectives that were used to formulate alternative plans for ecosystem restoration evaluation for the Upper Mississippi River-Illinois Waterway System Navigation Feasibility Study. Objectives for Water Level are summarized by site-specific dots on pool-scale maps and in bar charts for each Pool in Geomorphic Reach 3.

![]() U.S. Department of the Interior |
U.S. Geological Survey
U.S. Department of the Interior |
U.S. Geological Survey
URL: http://www.umesc.usgs.gov/nesp/reach_planning.html
Page Contact Information: Contacting the Upper Midwest Environmental Sciences Center
Page Last Modified:
March 13, 2014
